How to Use:
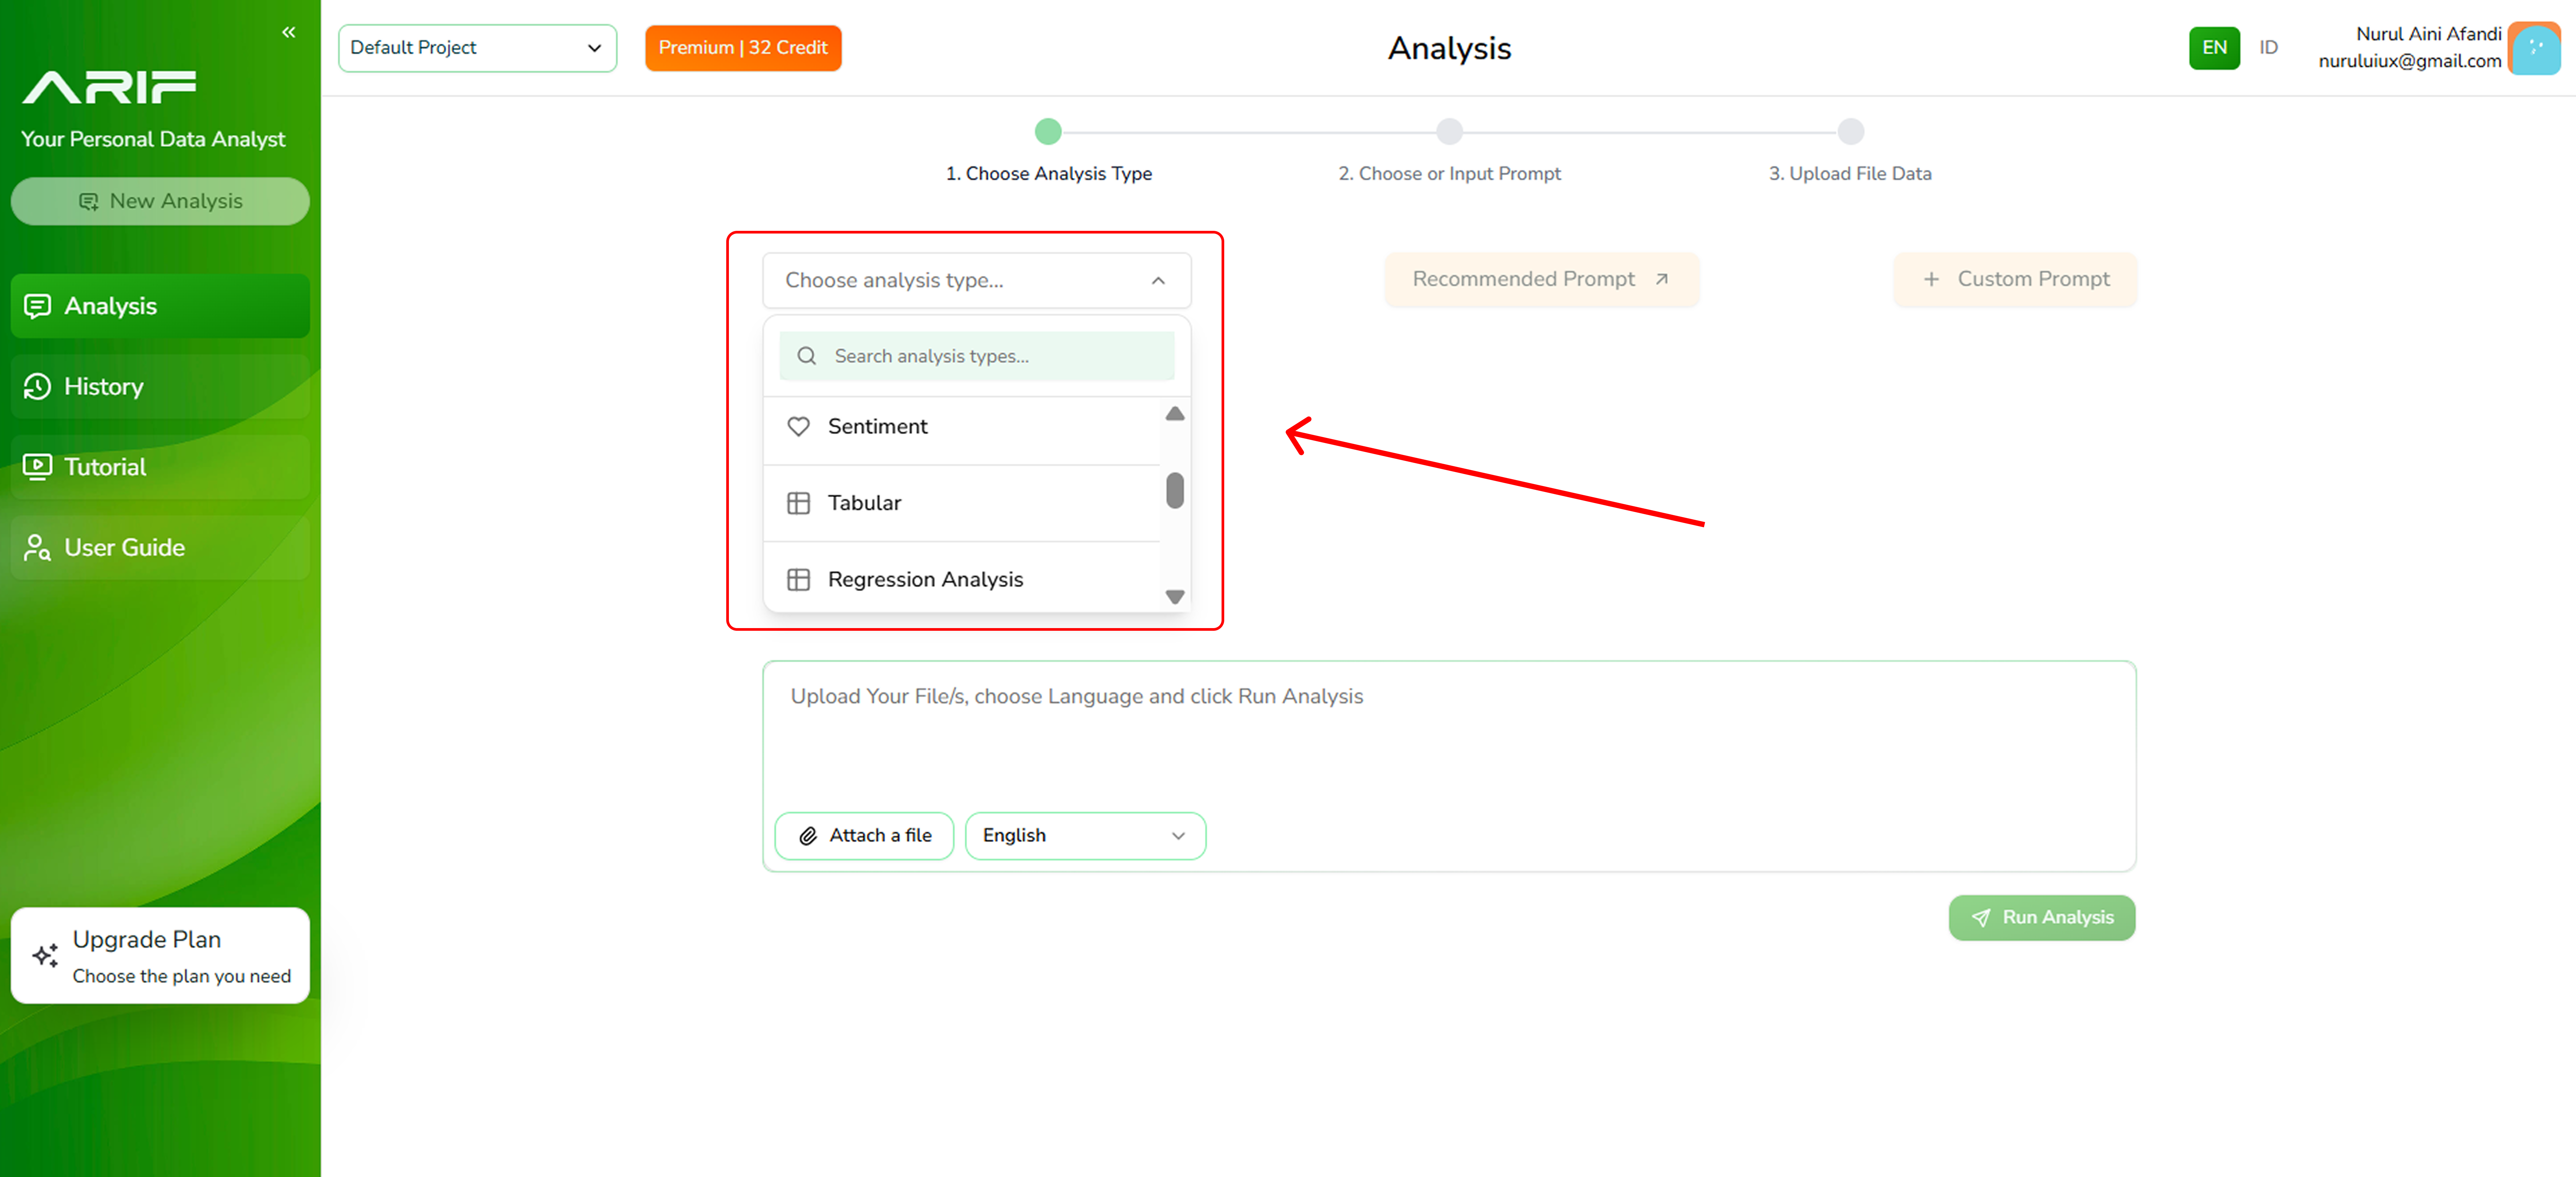
- Click “Choose analysis type” dropdown in the main menu then select “Tabular Analysis”.
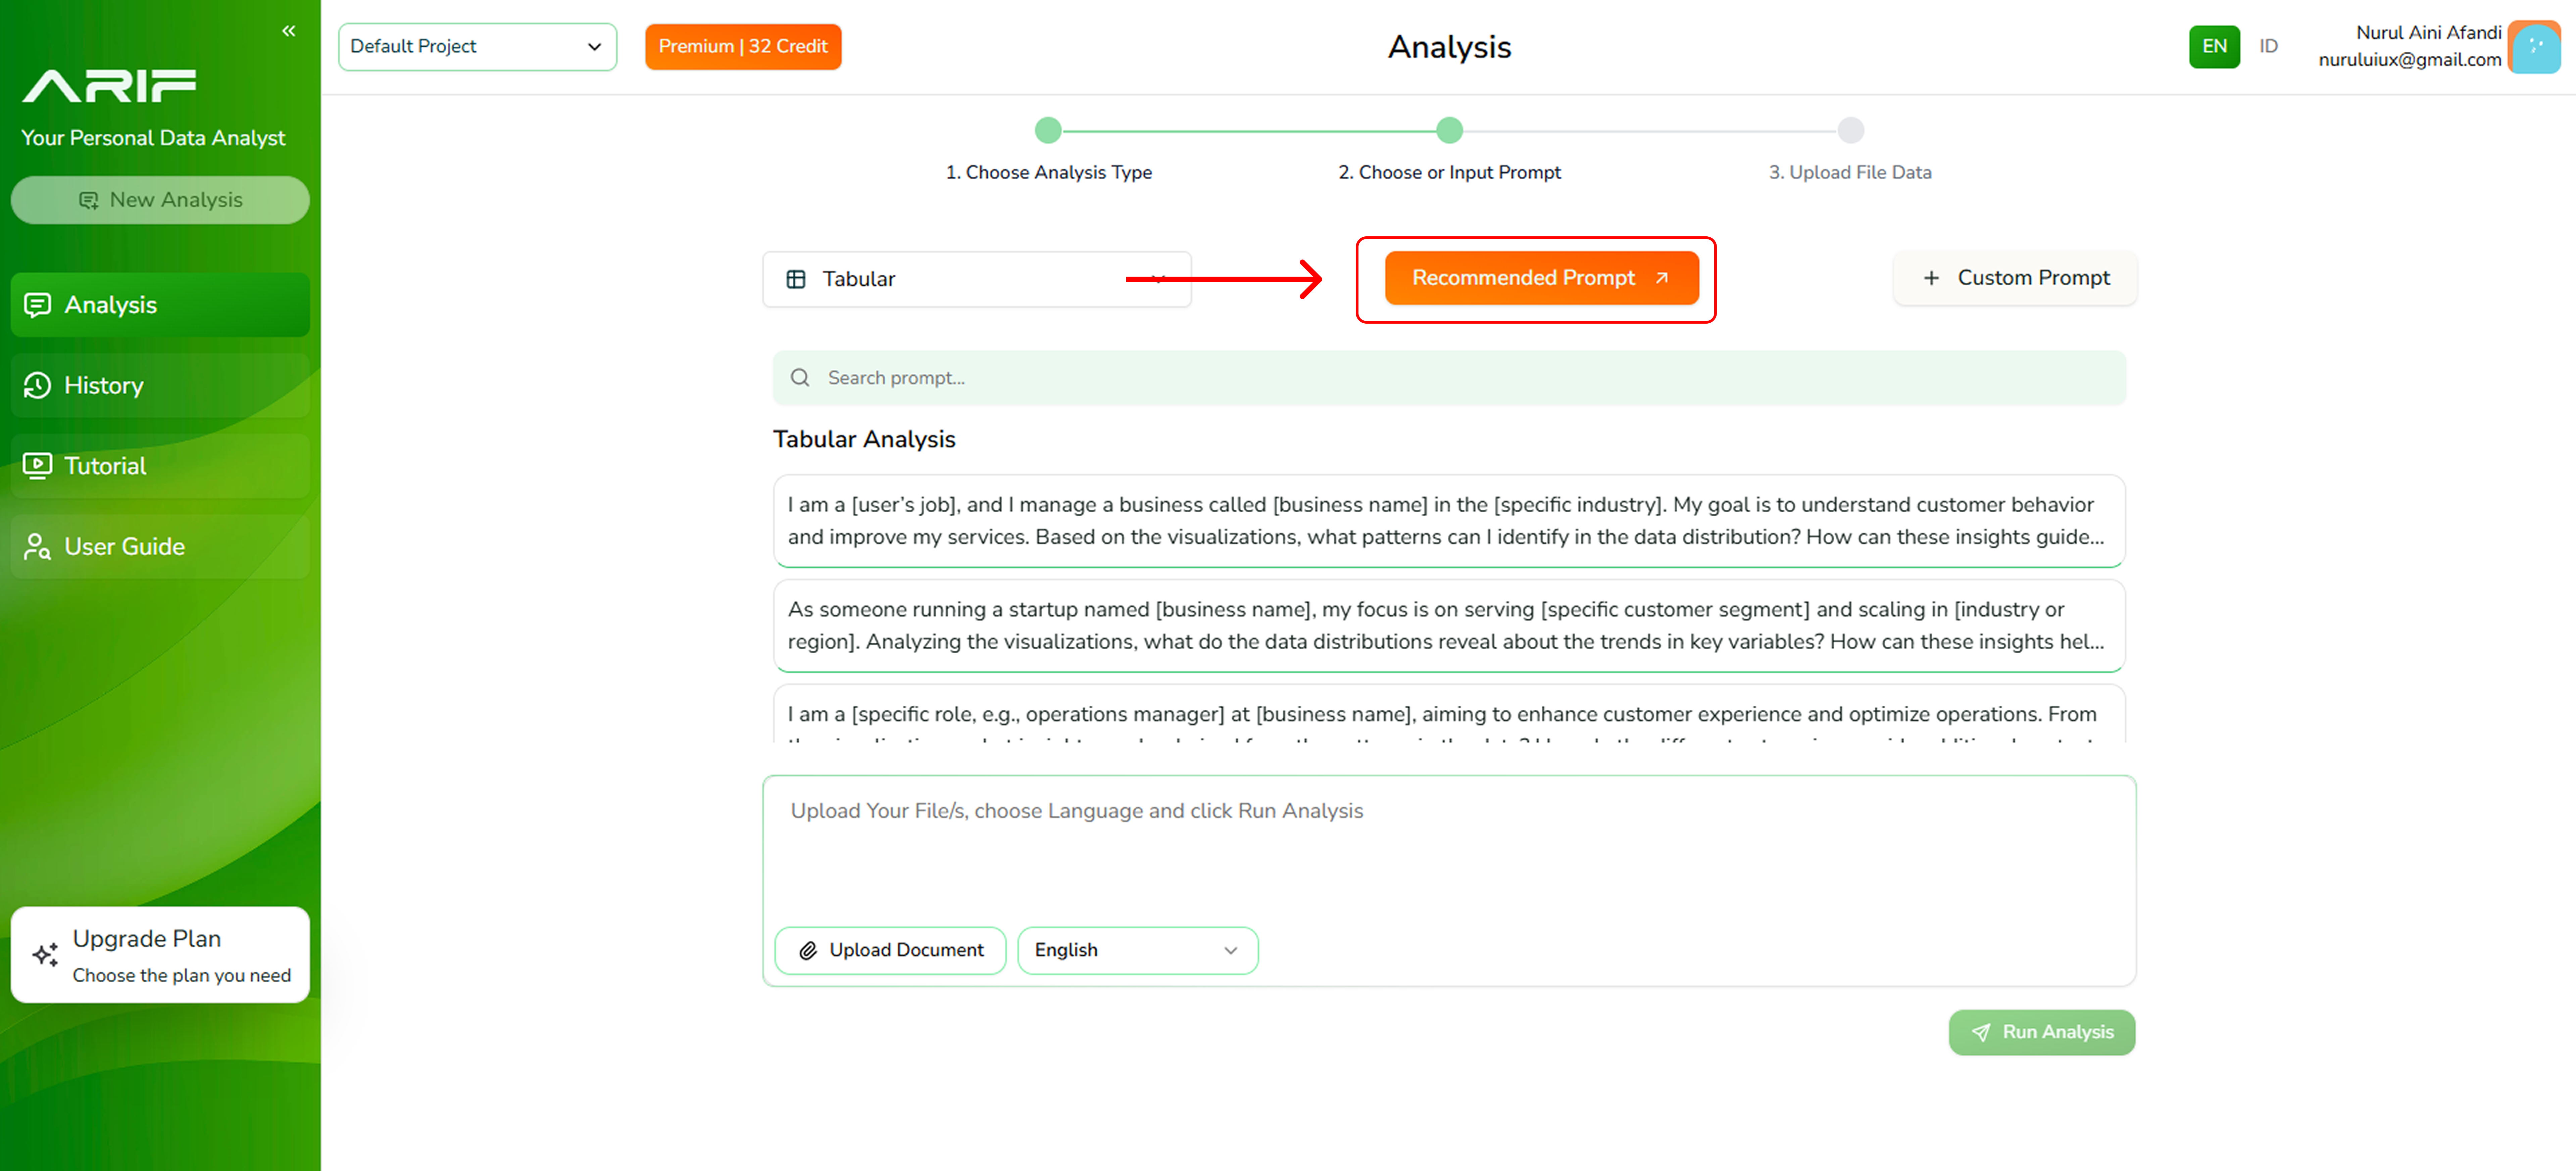
- You need a prompt which basically is a question or an instruction to drive the analysis result. Choose one of the Recommended Prompts from the list ****for a quick, expert-driven setup.
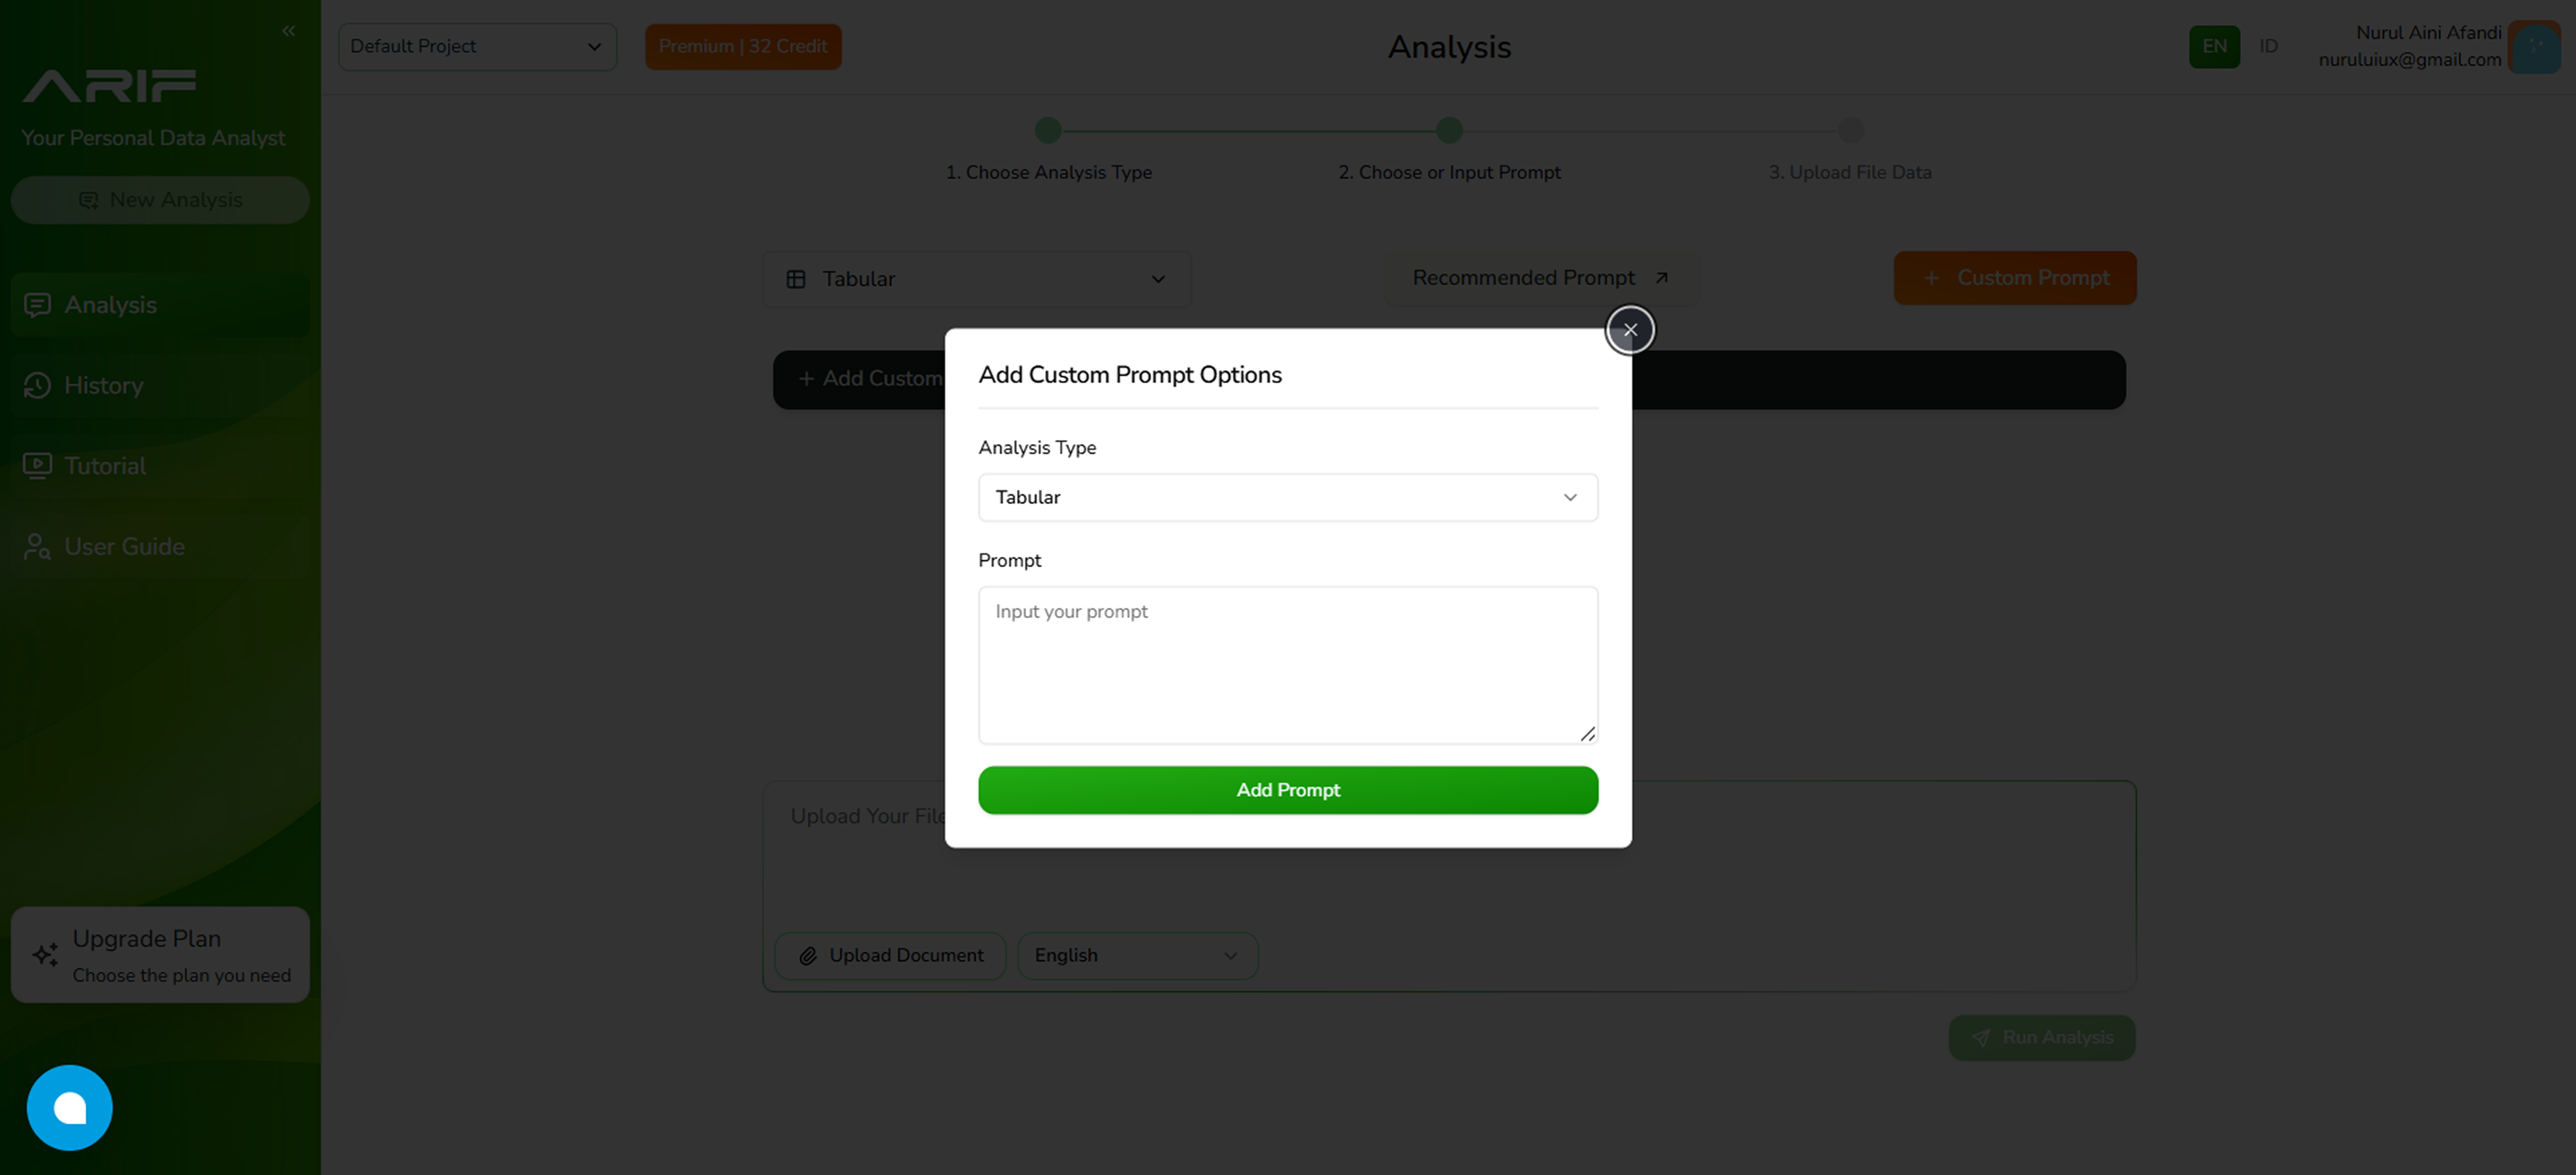
- Or write your own prompt depending on the insights you want to gain from your data by clicking the “Custom Prompt” button.
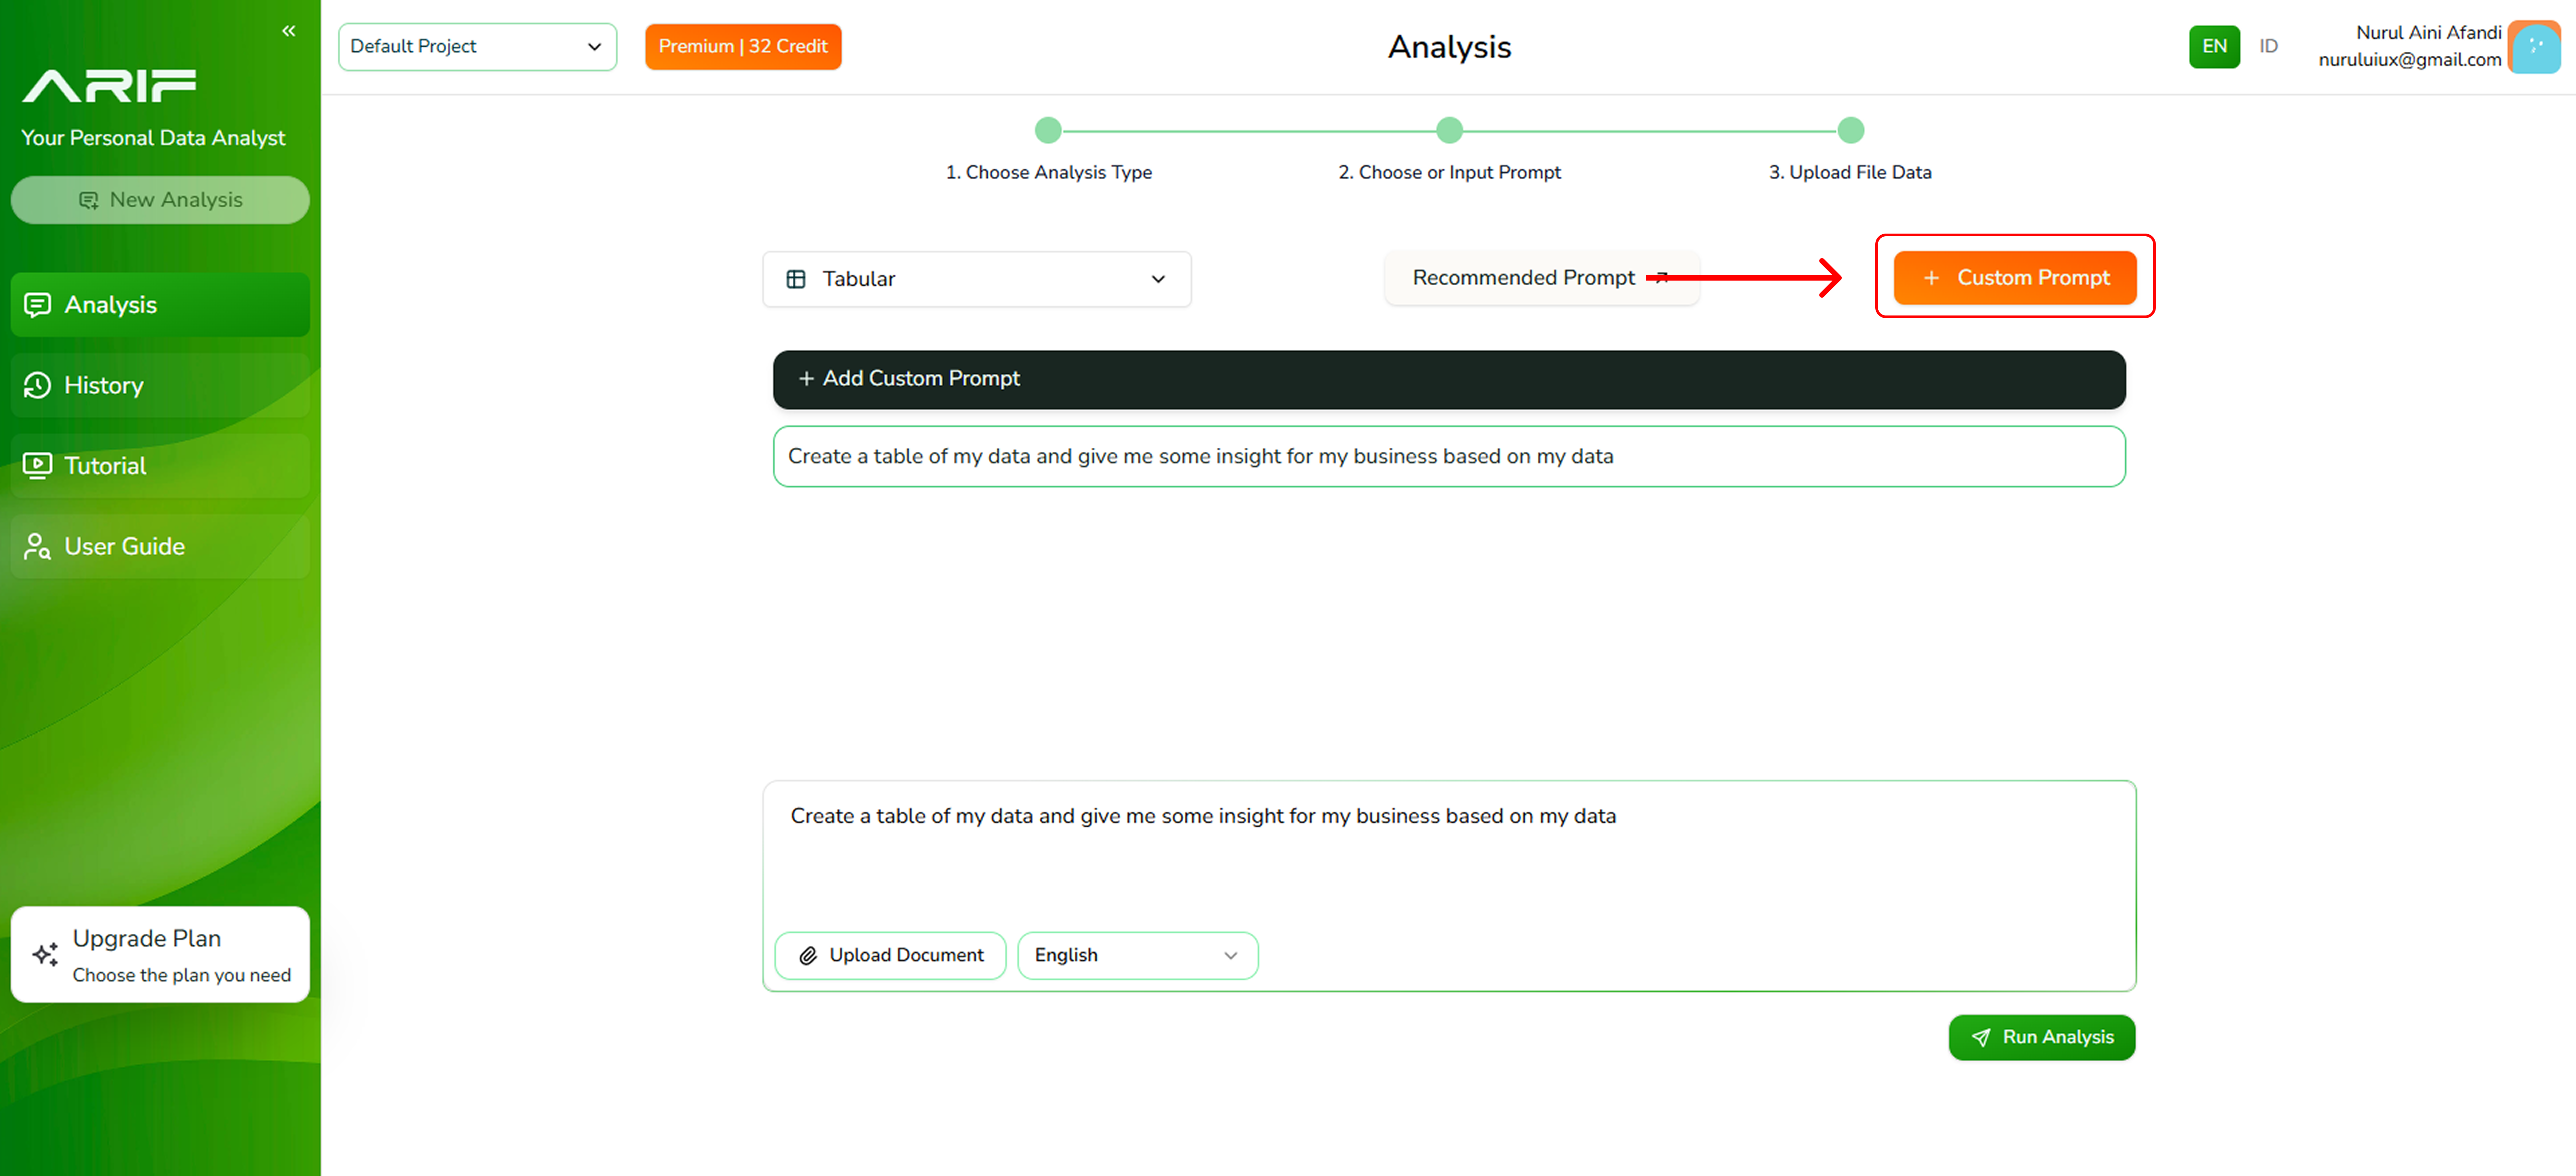
- If you choose to create your own prompt, click “+ Add Custom Prompt”. A pop-up window will appear where you can write your prompt.
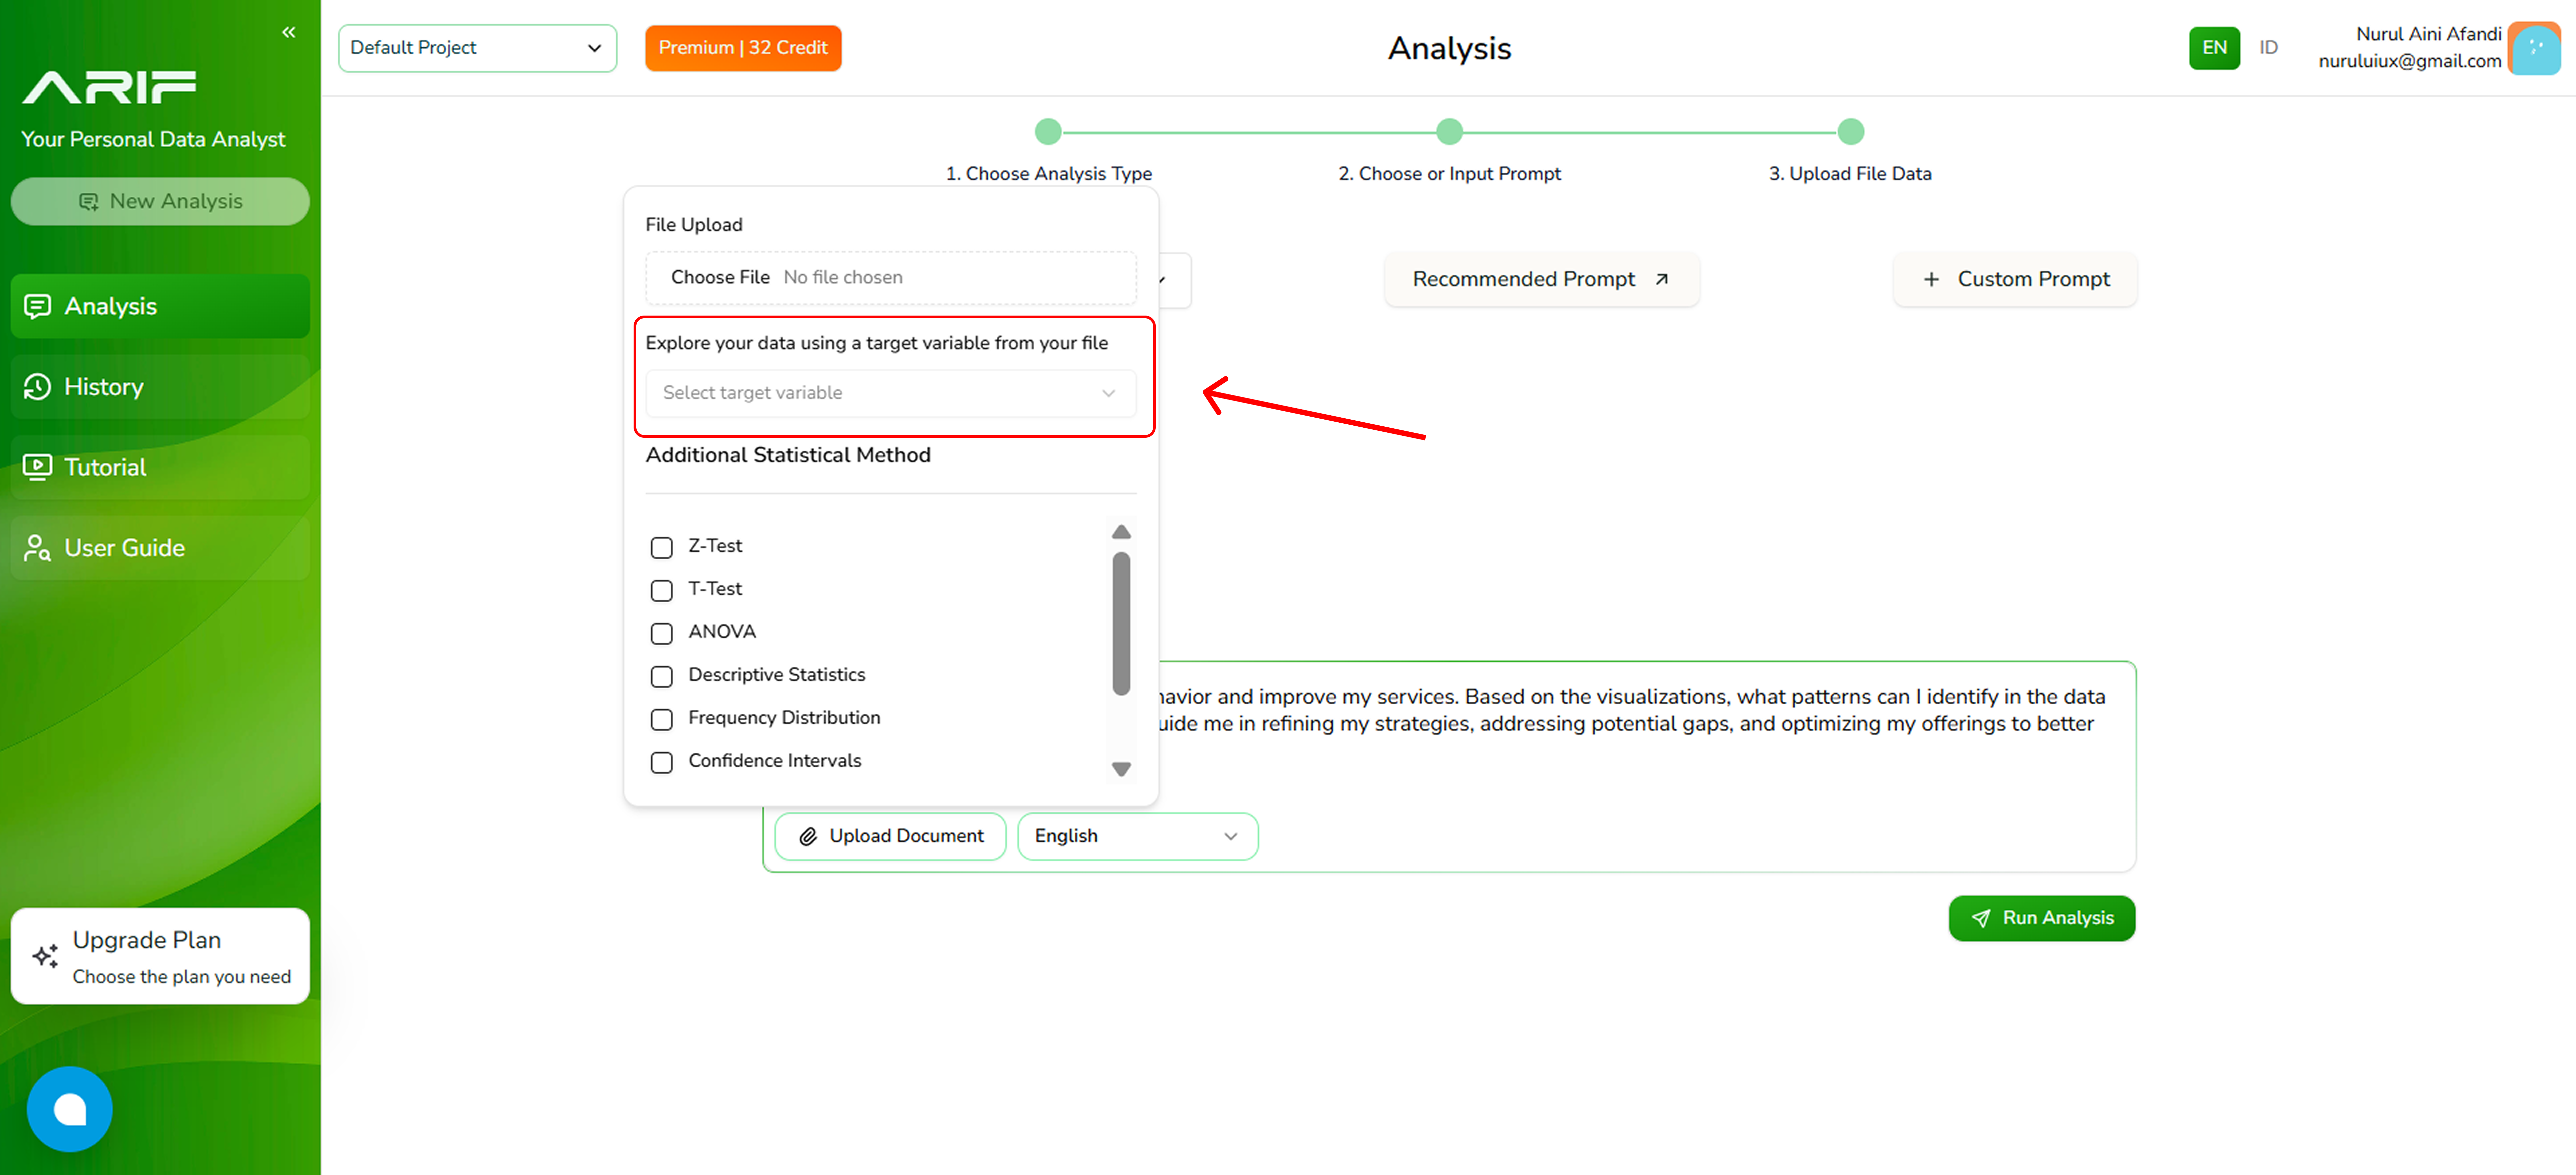
- Click the “Upload Document” button to upload your files in one of the supported formats: .csv or .xls with a maximum file size of 2 MB each.

- Select the target column or variable you want to analyze. You can only choose a target variable with approximately 2 to 7 unique values.
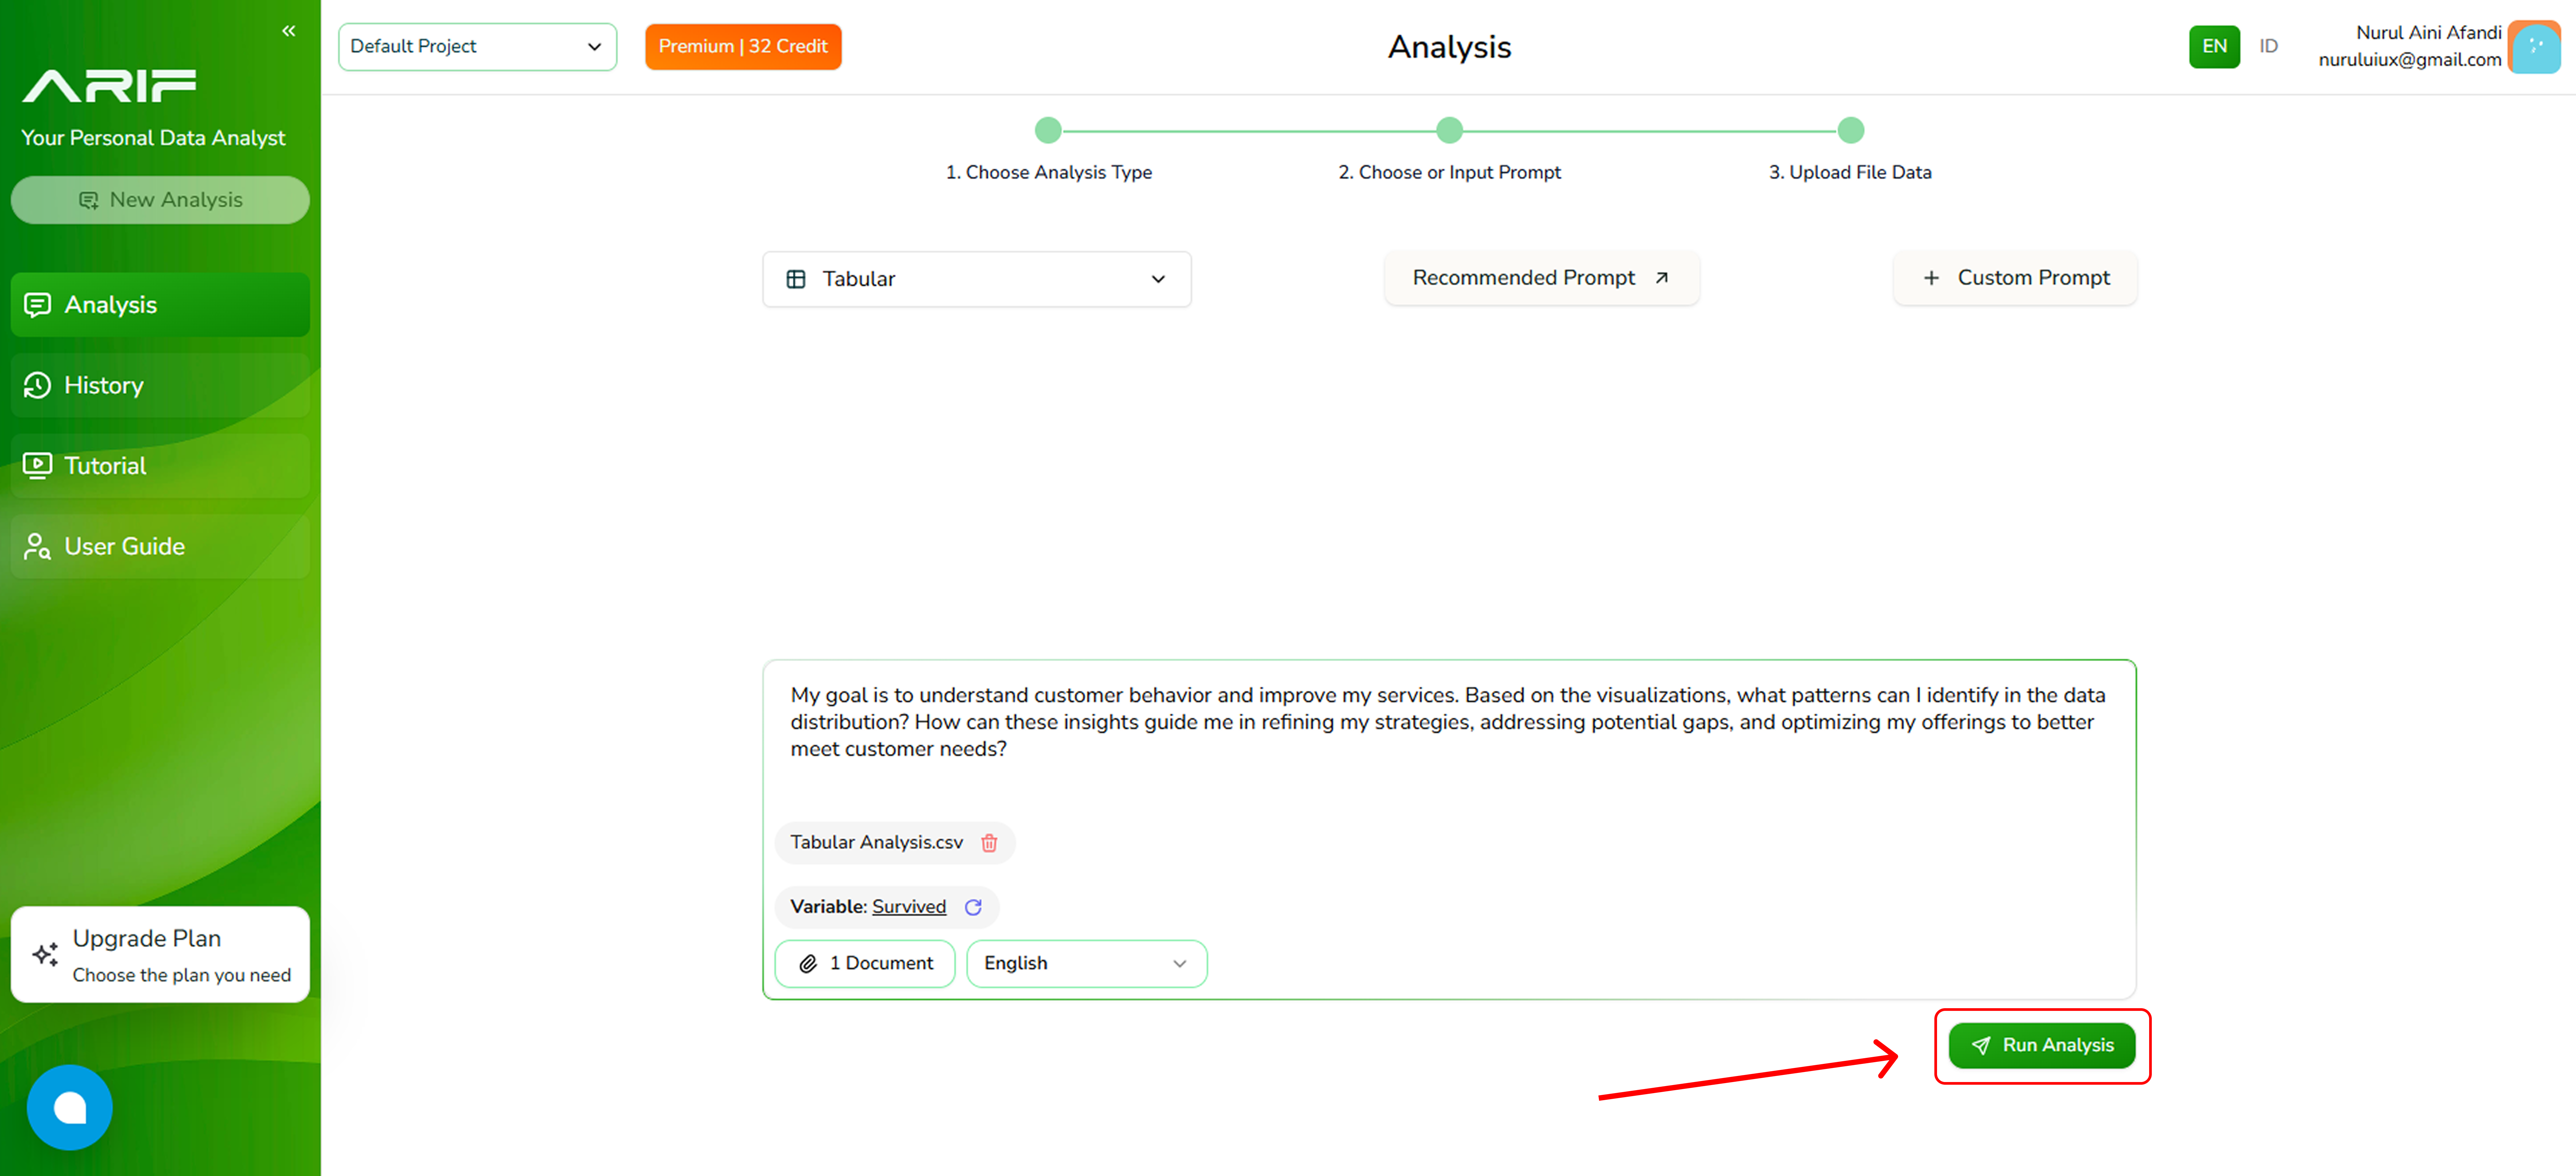
- Make sure you’ve selected the correct prompt and file, then click “Run Analysis” and wait for the system to process your data. The processing time depends on the file size.
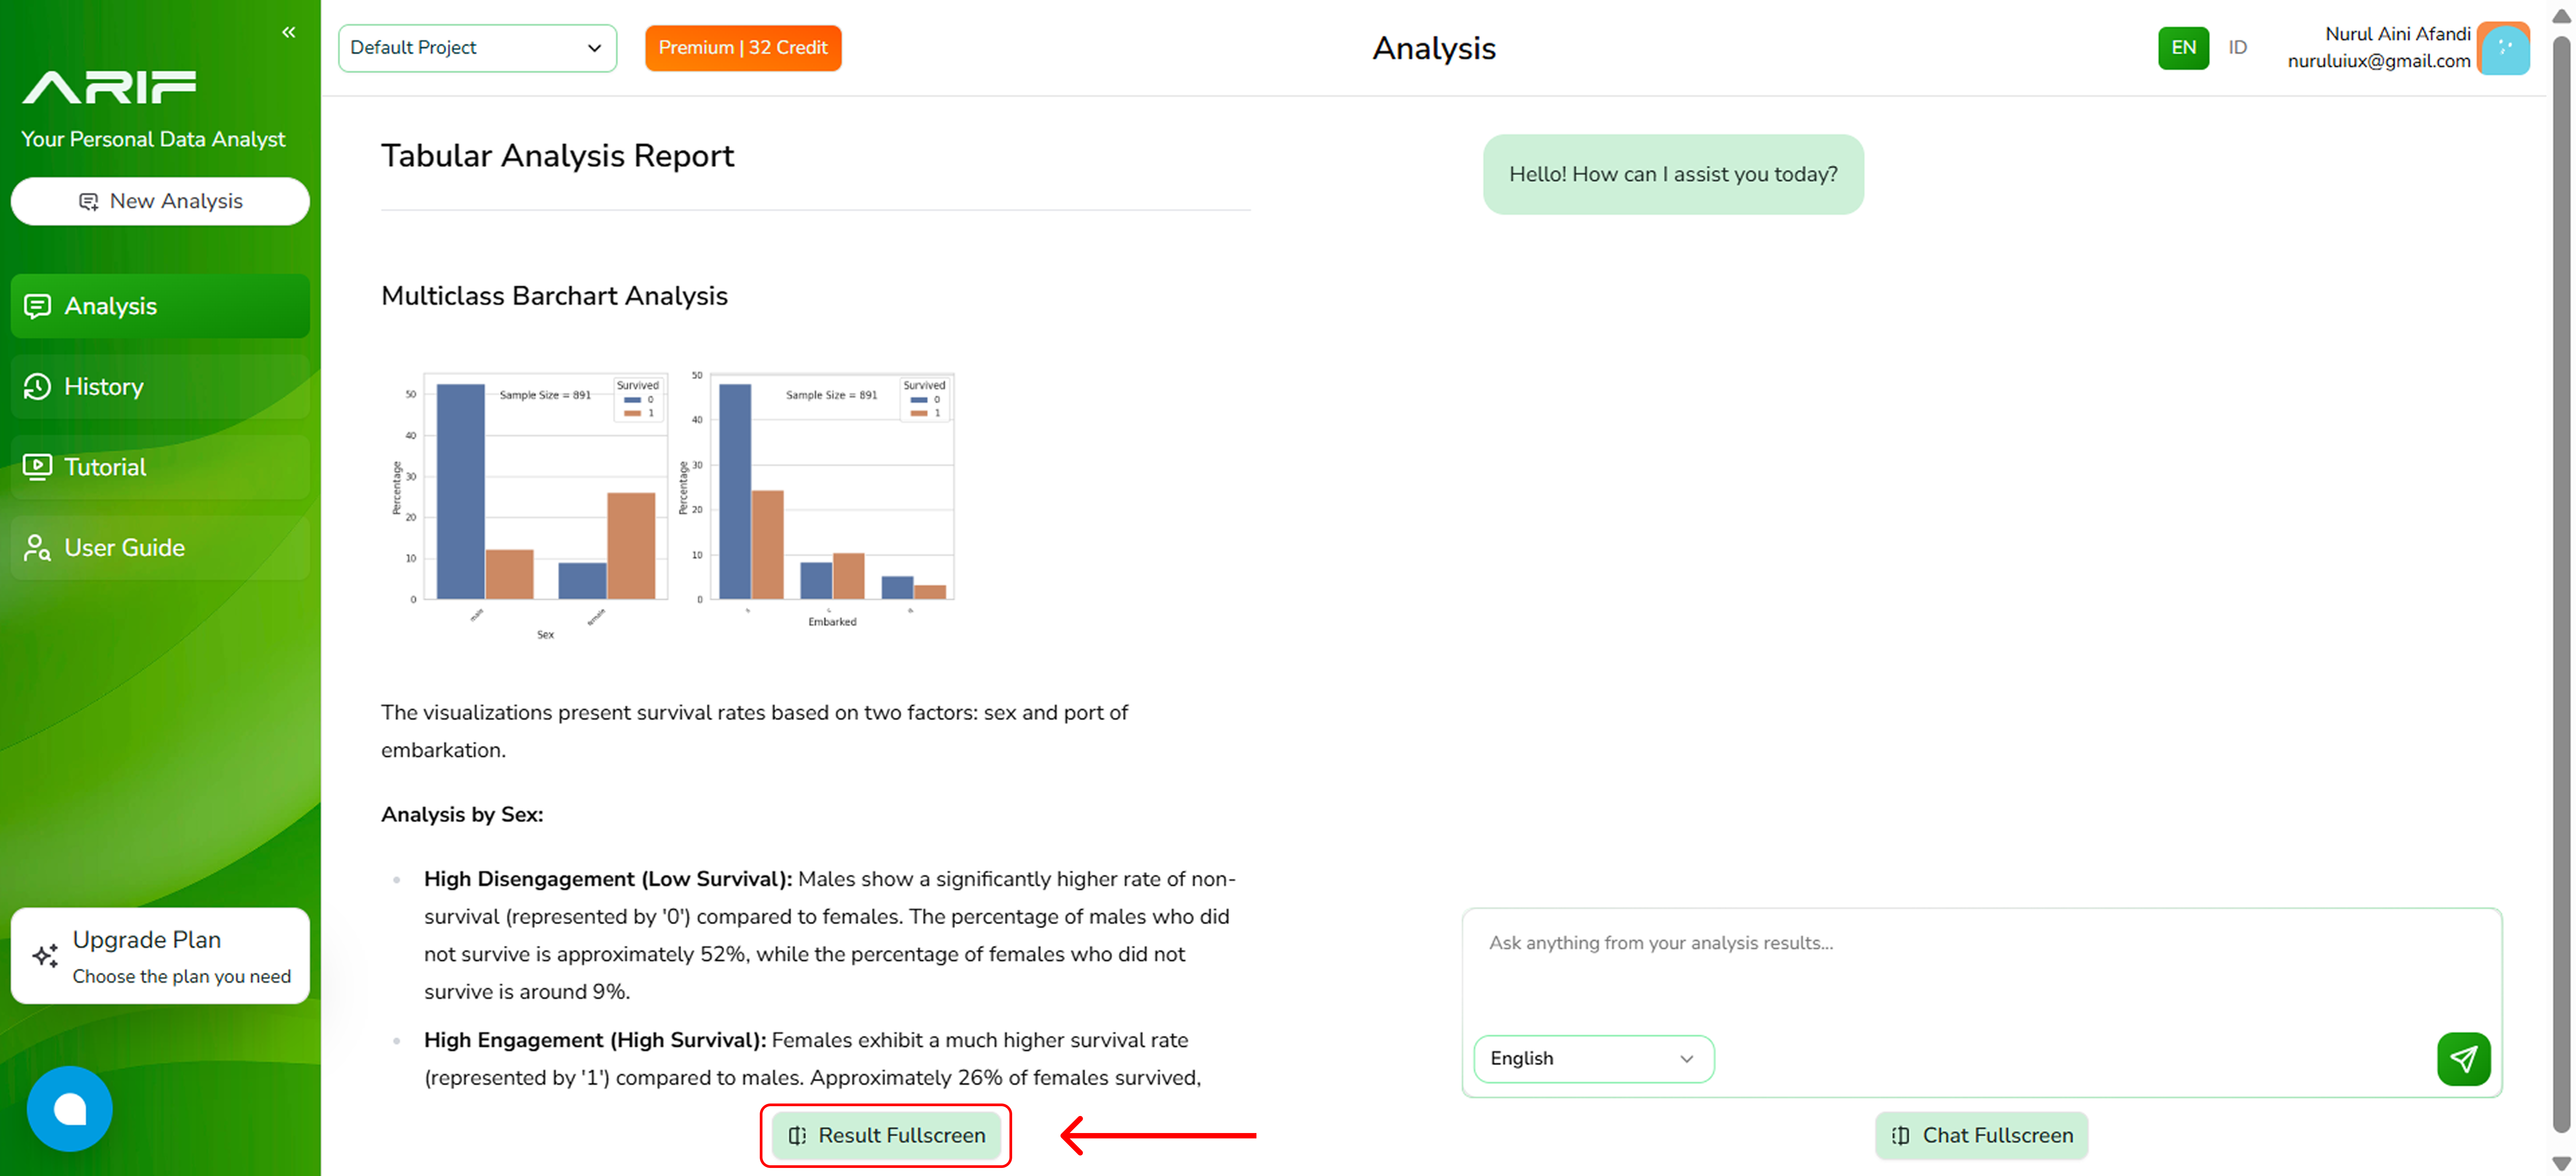
- The analysis results will appear on the left panel, while the right panel allows you to ask follow-up questions about the analysis.
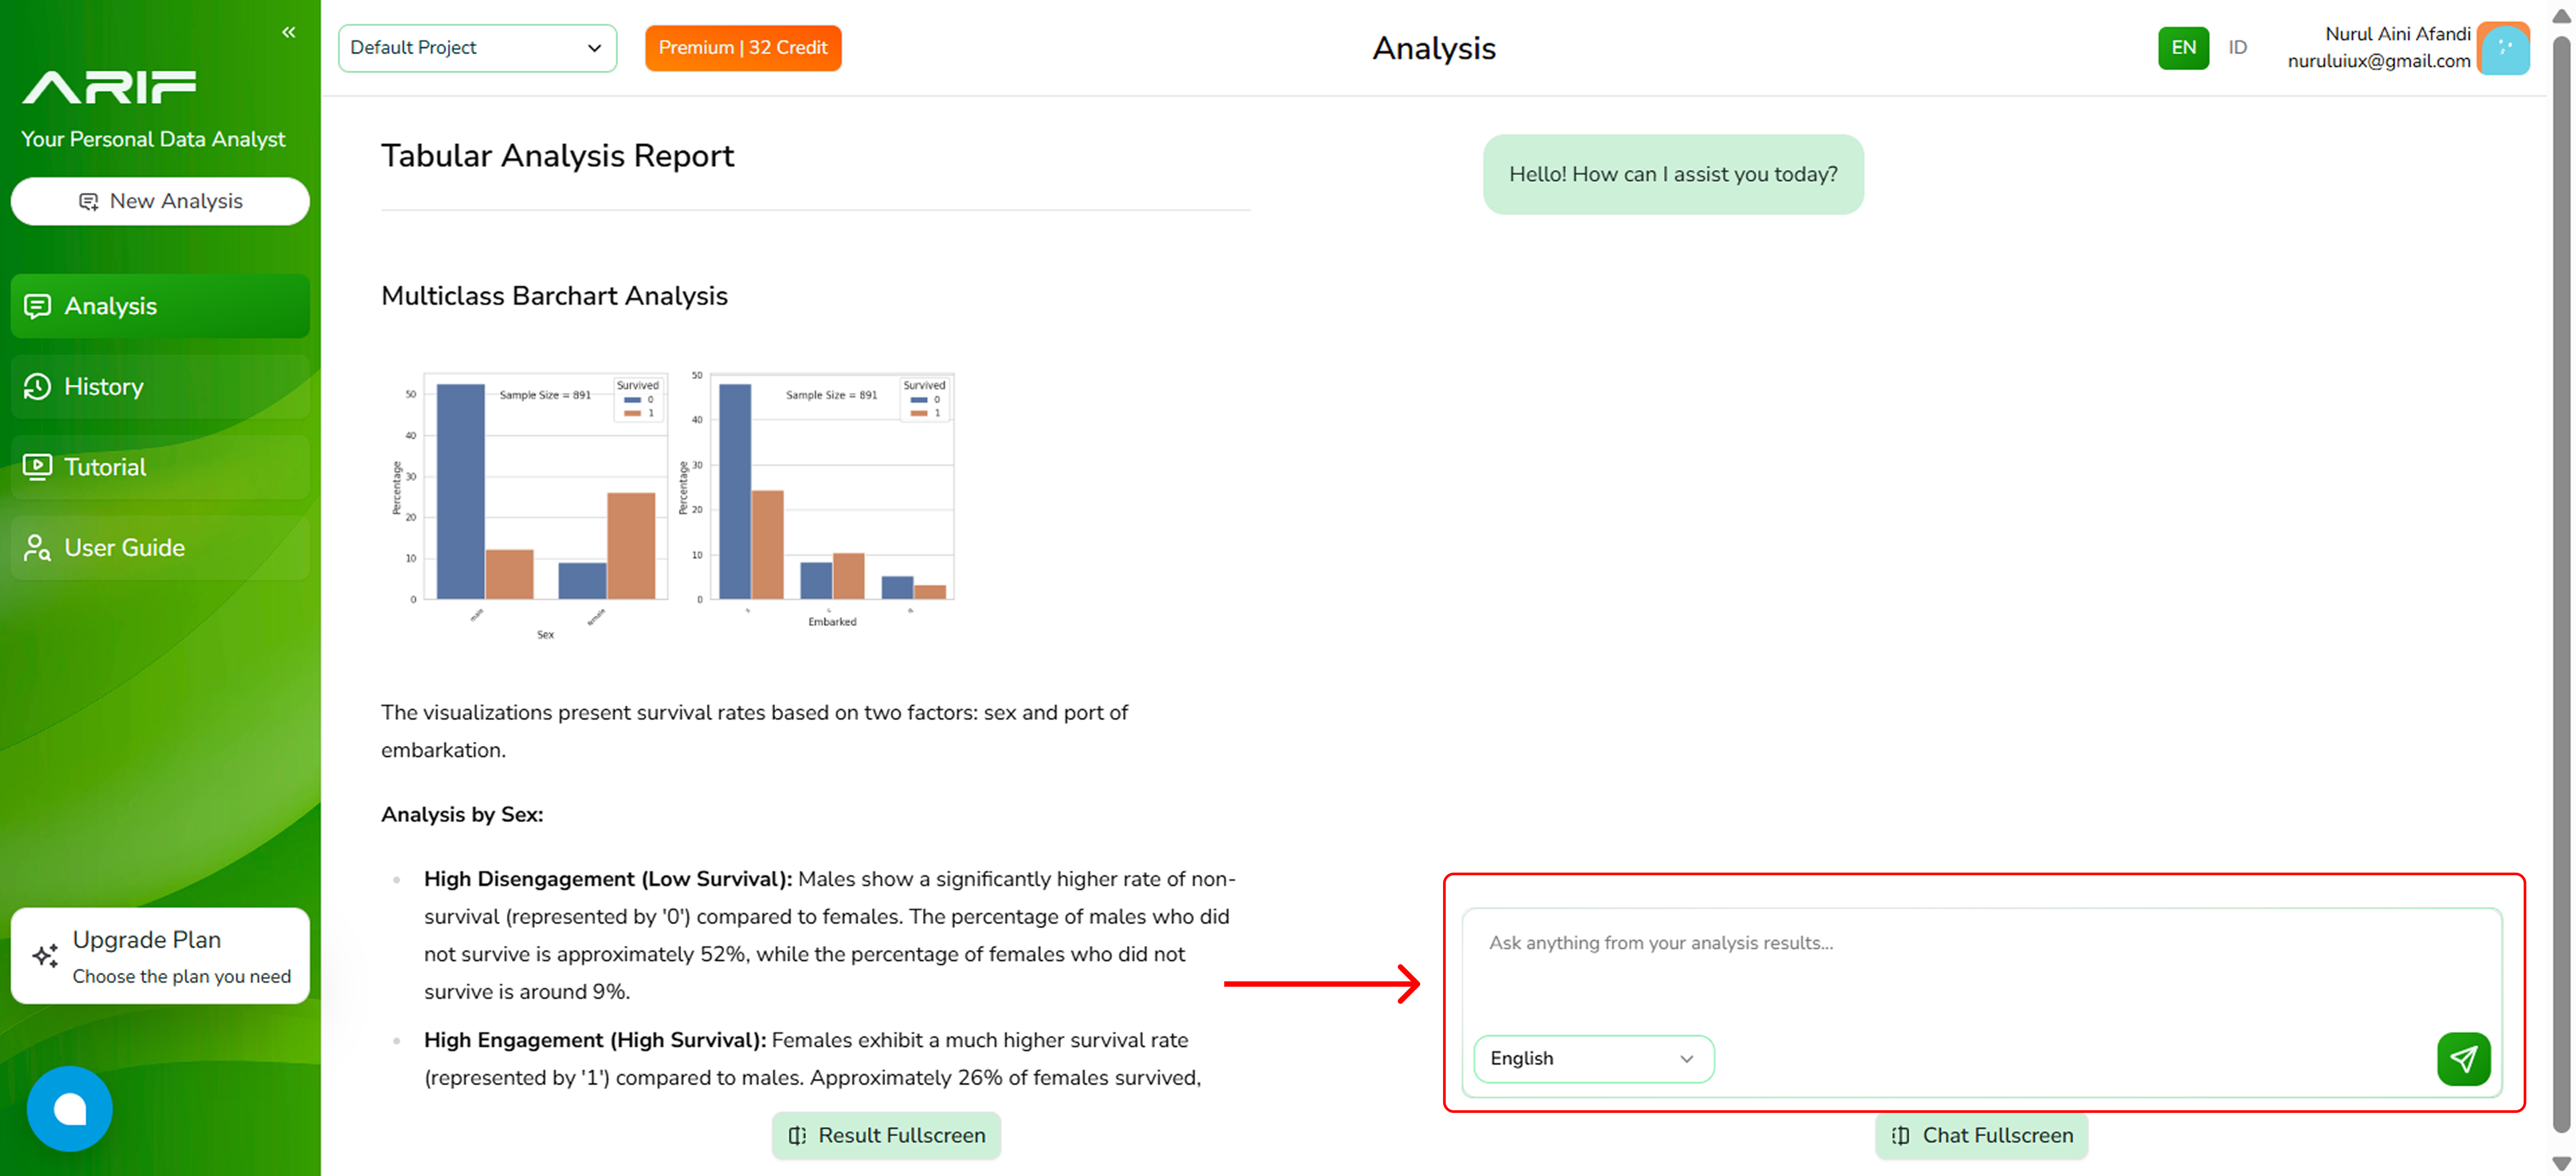
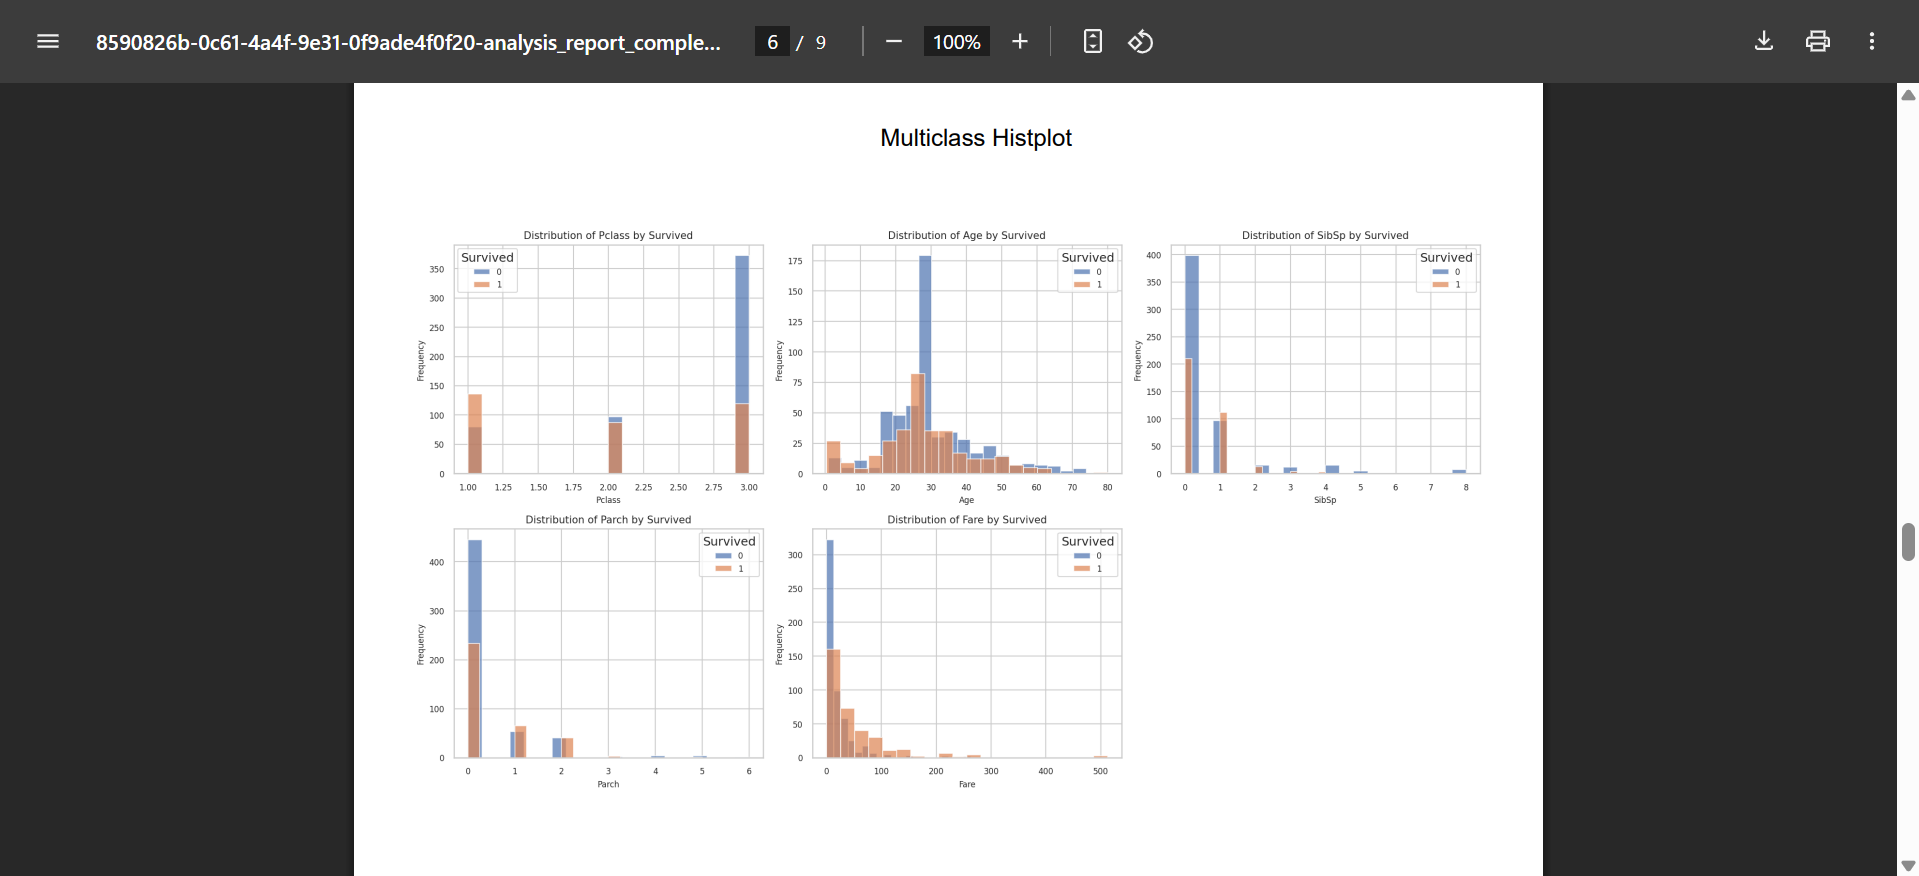
- If you wish to view a full screen of your result analysis, click on “Result Fullscreen” at the bottom of the panel to expand the view.
- Then Press “Download Analysis Result” to choose the file type you want to download. You can select Insight Summary for a curated, high-level overview, or Statistical Analysis for insights with statistical calculation.
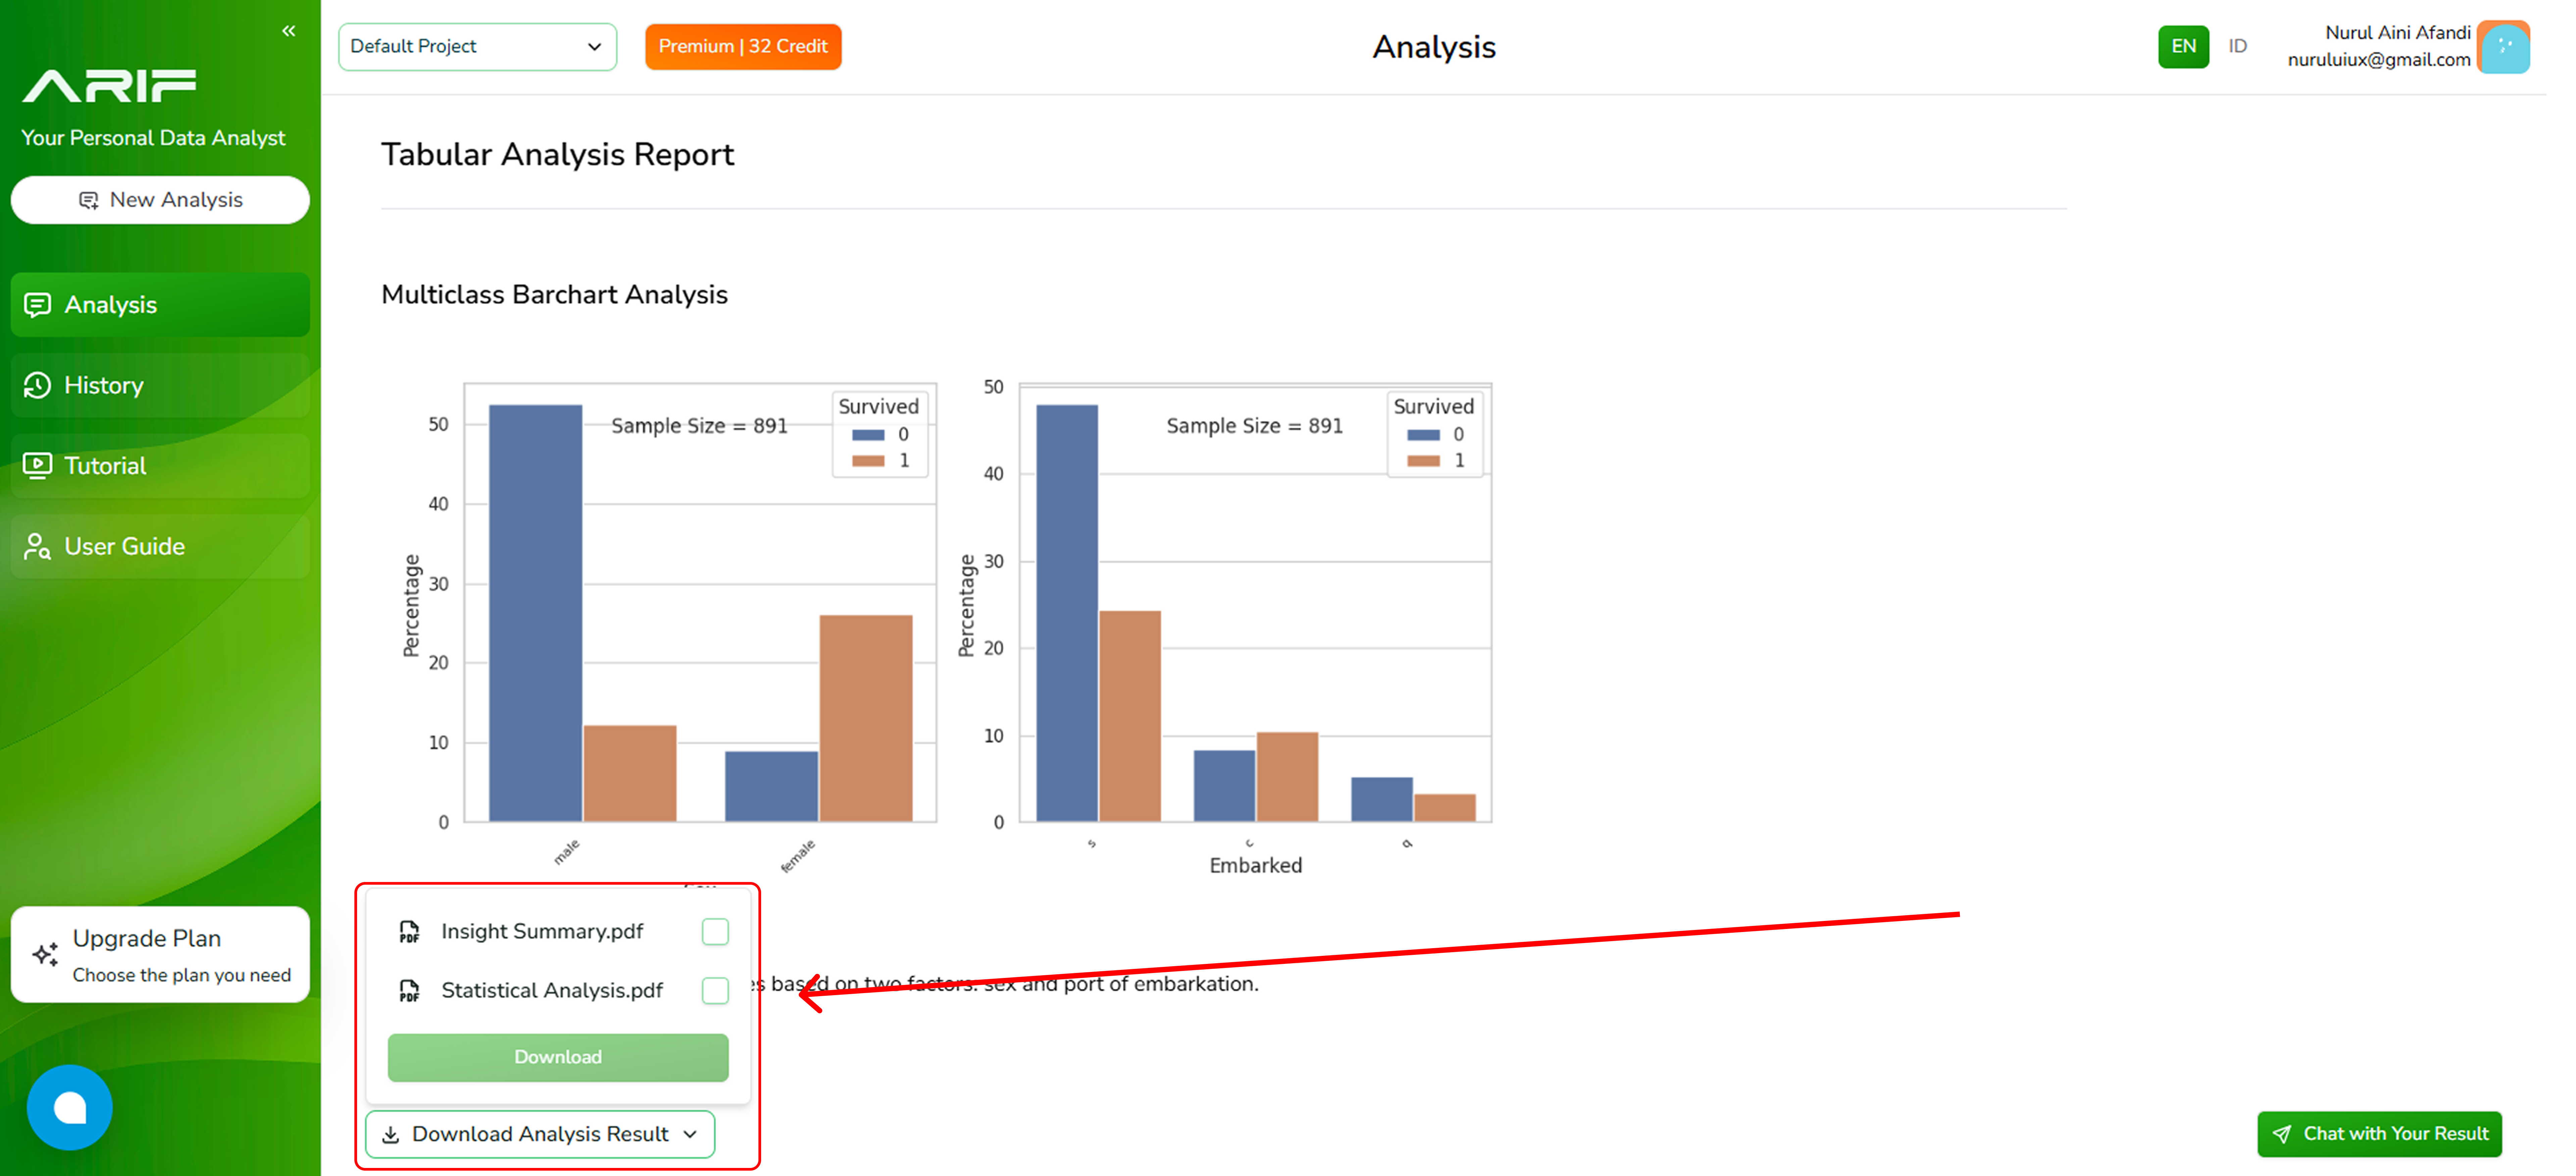
- Your analysis results are now available in PDF format.