> ## Documentation Index
> Fetch the complete documentation index at: https://docs.goarif.co/llms.txt
> Use this file to discover all available pages before exploring further.
# Factor Analysis
> Factor Analysis to simplify the set data by finding underlying patterns and grouping similar variables.
To get started quickly and efficiently, you can watch the video tutorial above. It provides a step-by-step guide to help you understand the process more easily before diving into the written instructions below.
## **How to Use:**
1. Click **“Choose analysis type”** dropdown in the main menu then select **“Factor Analysis”.**
2. You need a prompt which basically is a question or an instruction to drive the analysis result. Choose one of the **Recommended Prompts** from the list for a quick, expert-driven setup.
3. Or write your own prompt depending on the insights you want to gain from your data by clicking the **“Custom Prompt”** button.
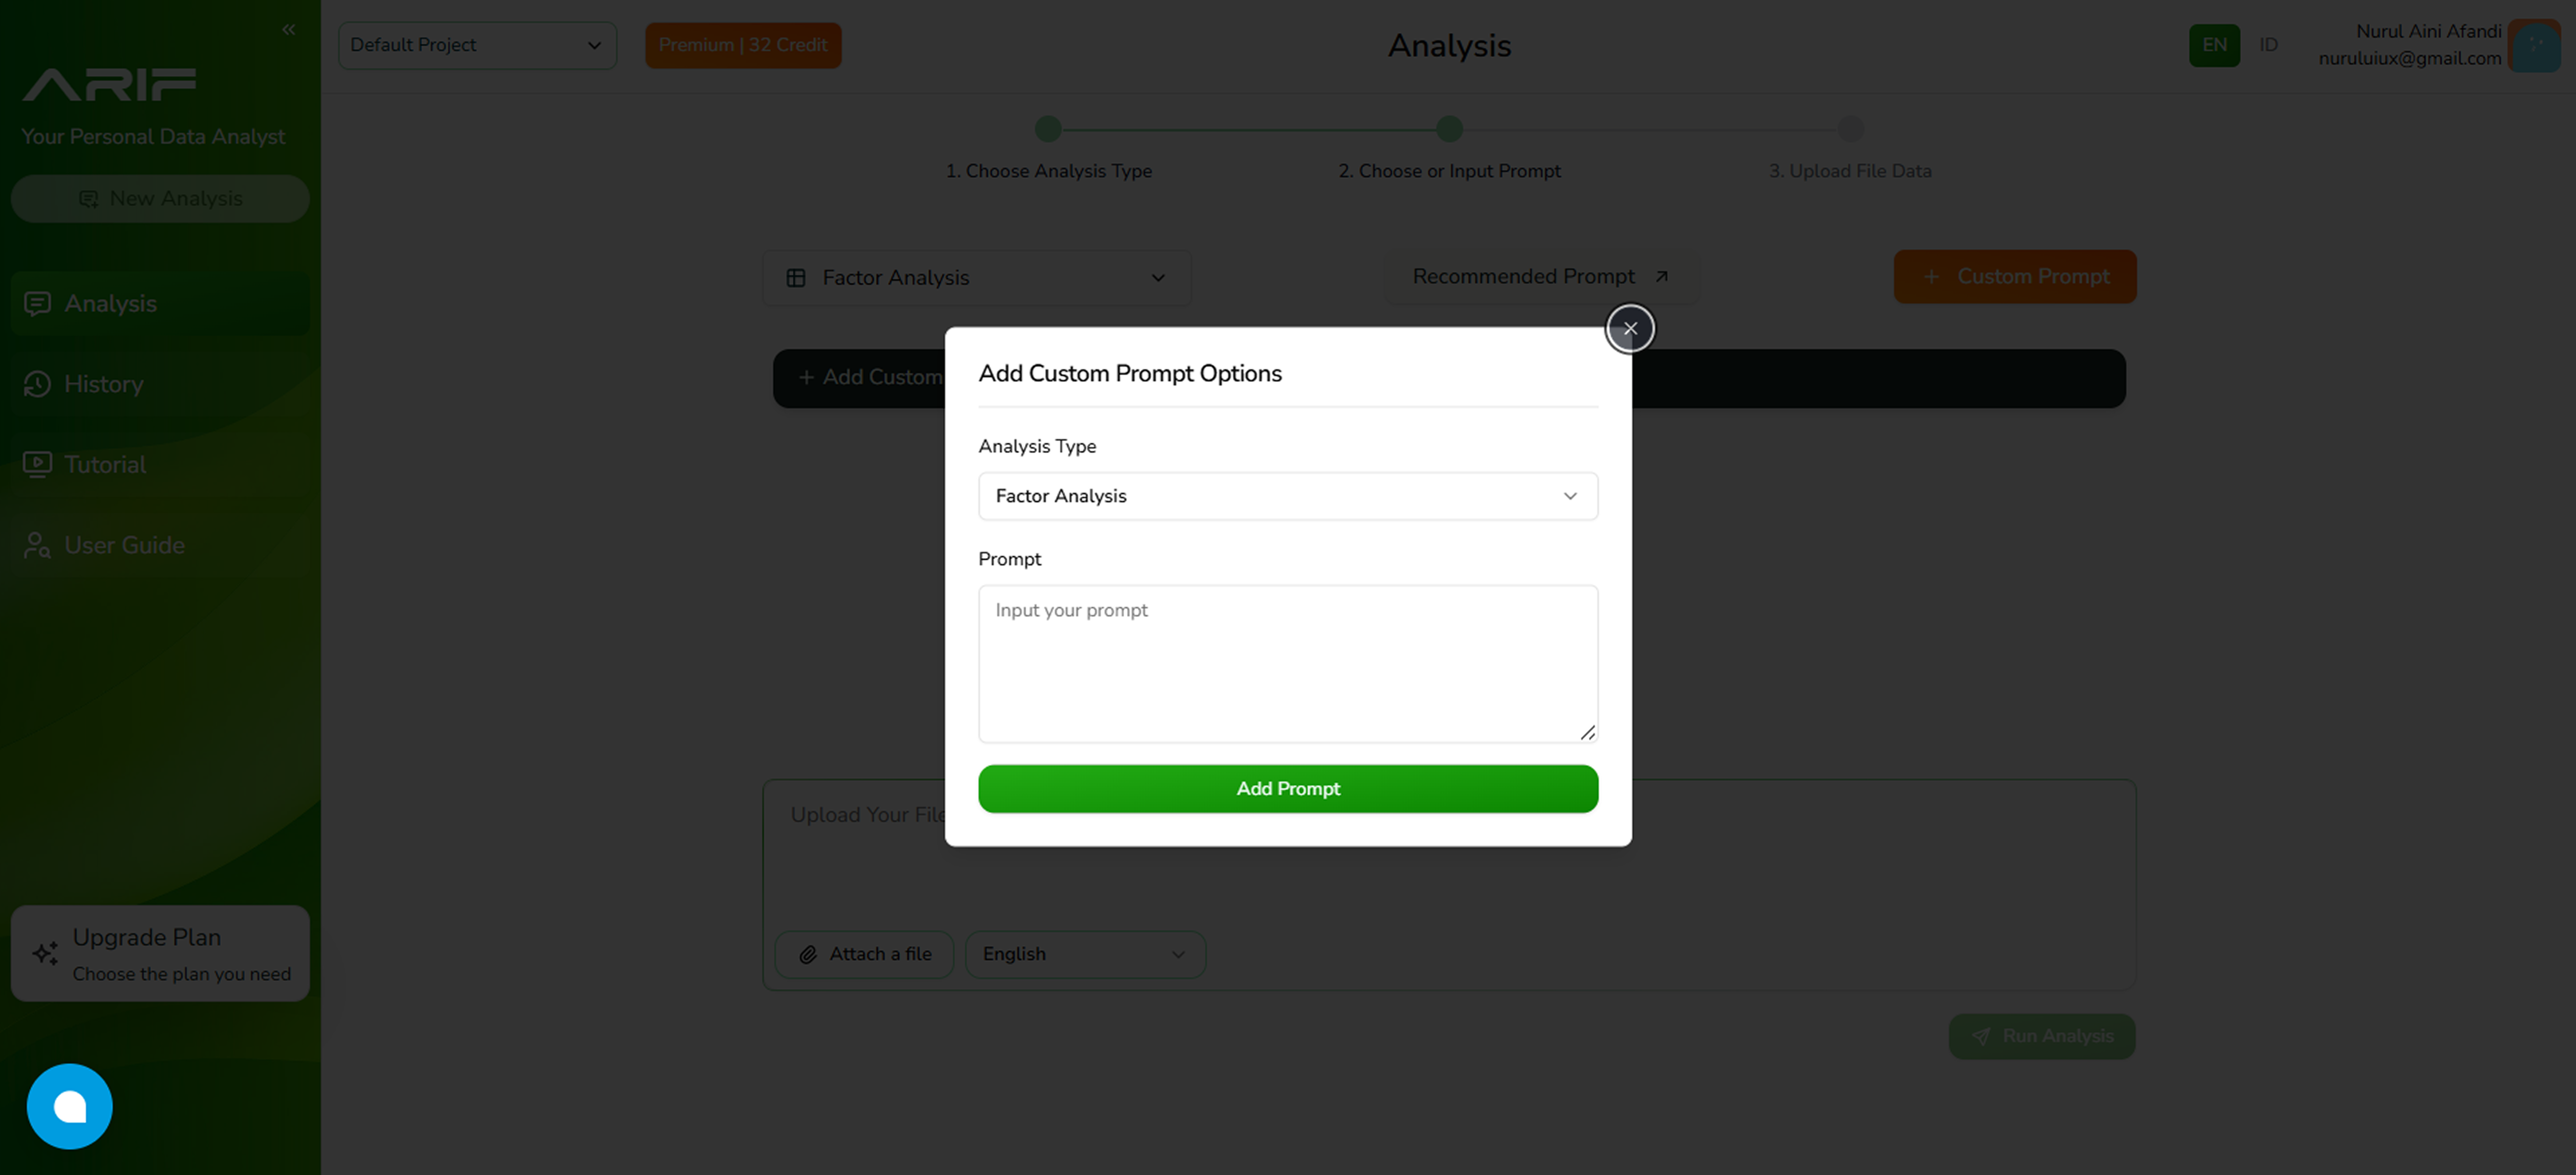
4. If you choose to create your own prompt, click **“+ Add Custom Prompt”**. A pop-up window will appear where you can write your prompt.
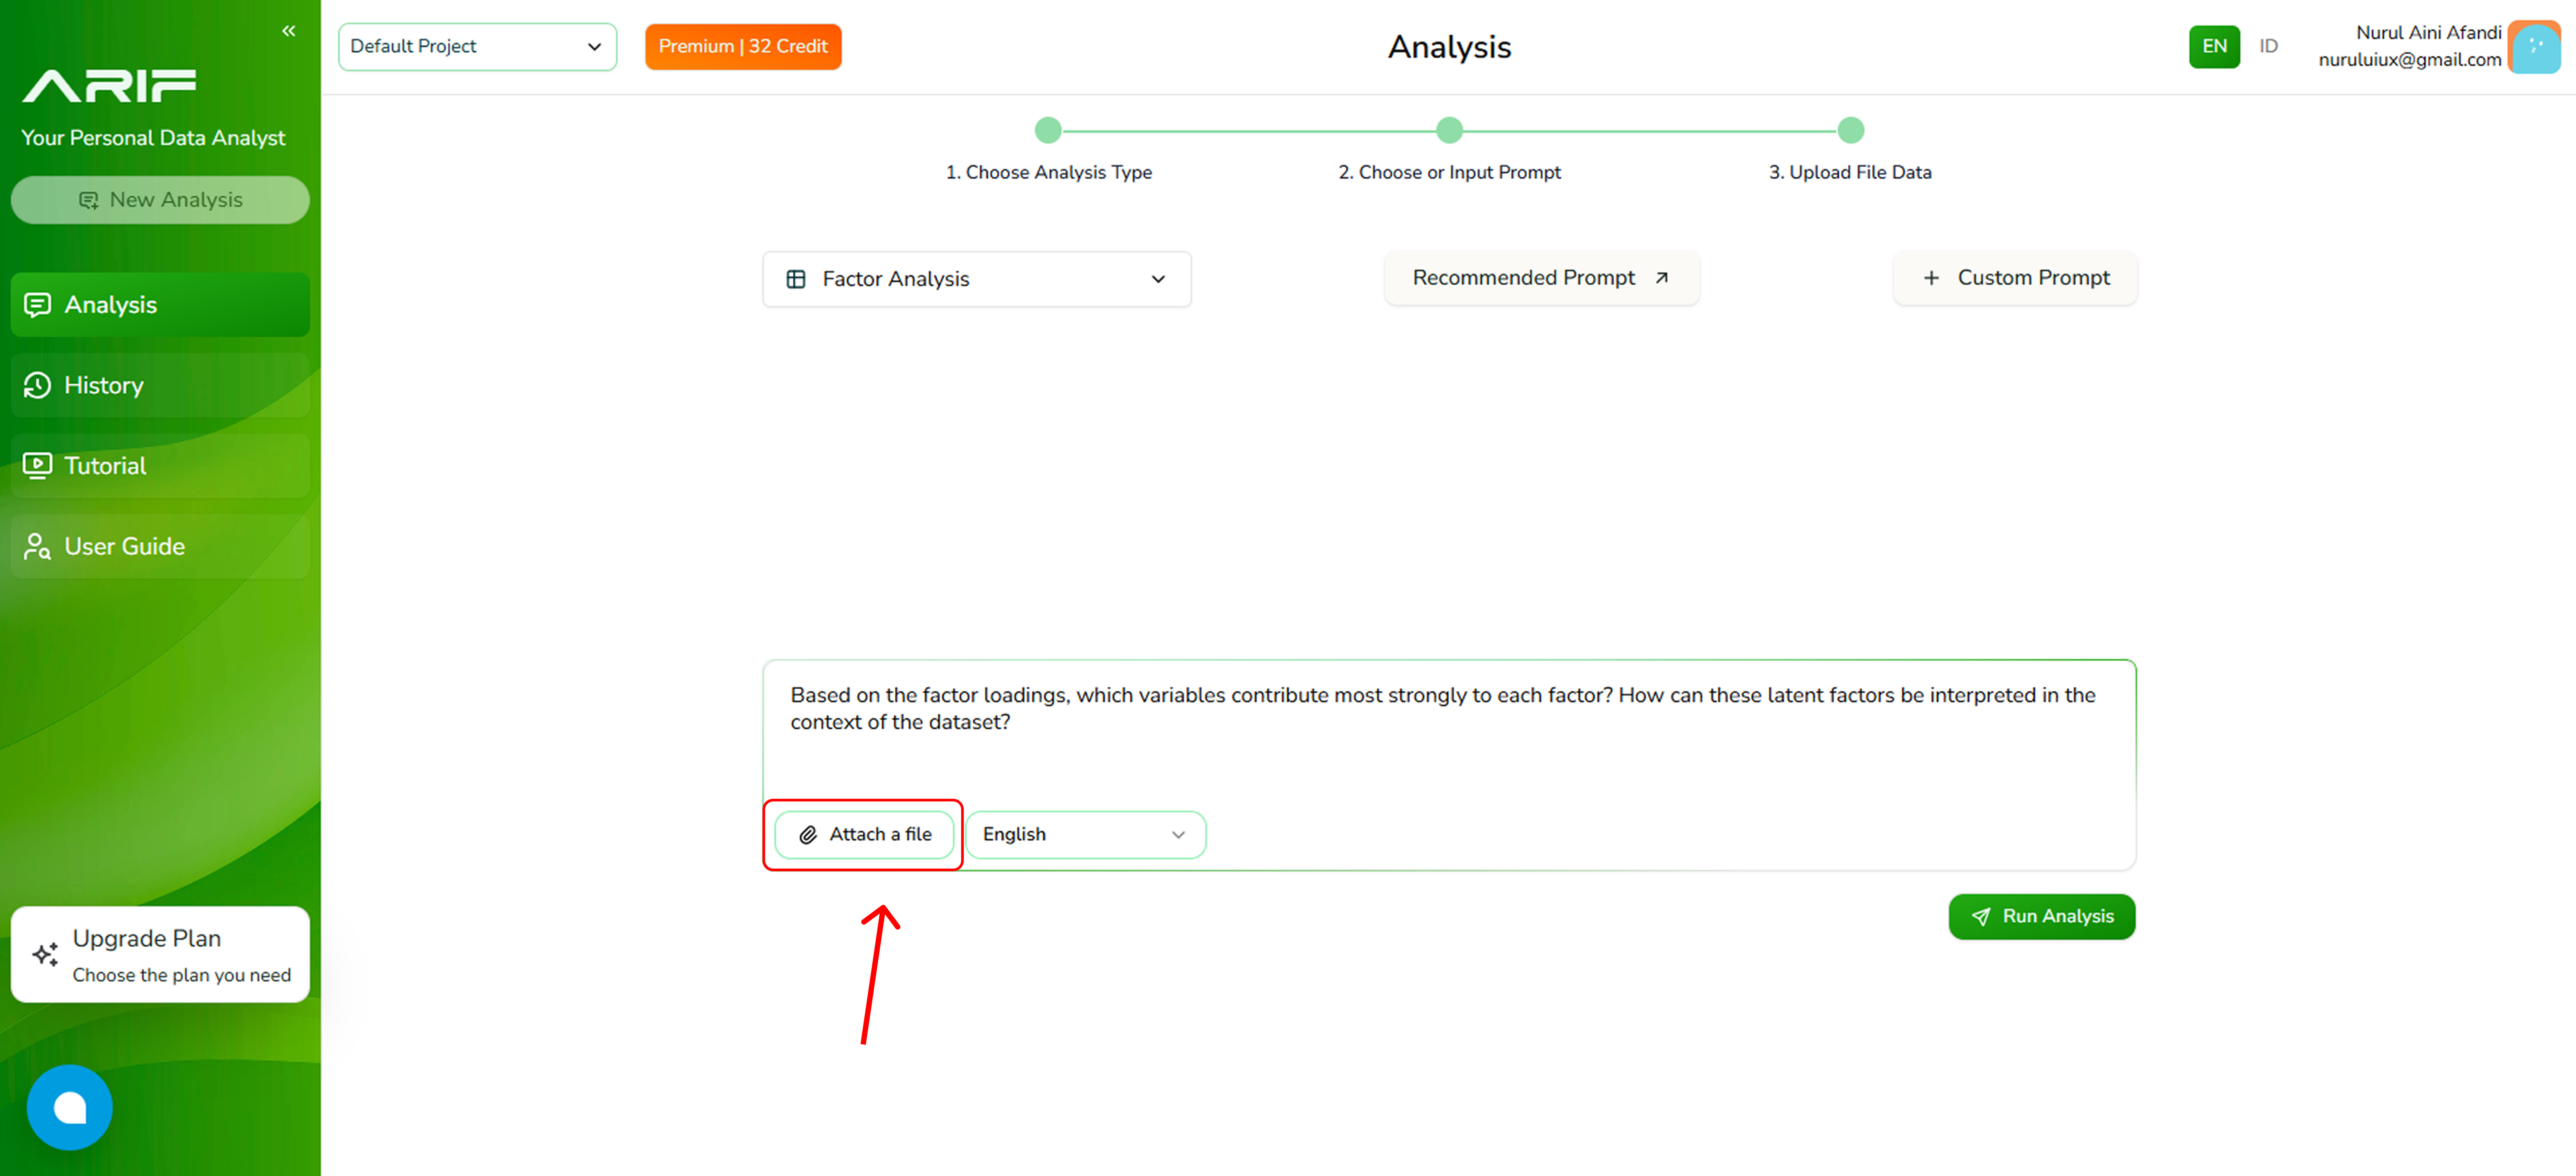
5. Click the **“Attach a File”** button to upload your file in one of the supported formats: .csv or .xls with a maximum file size of 2 MB each.
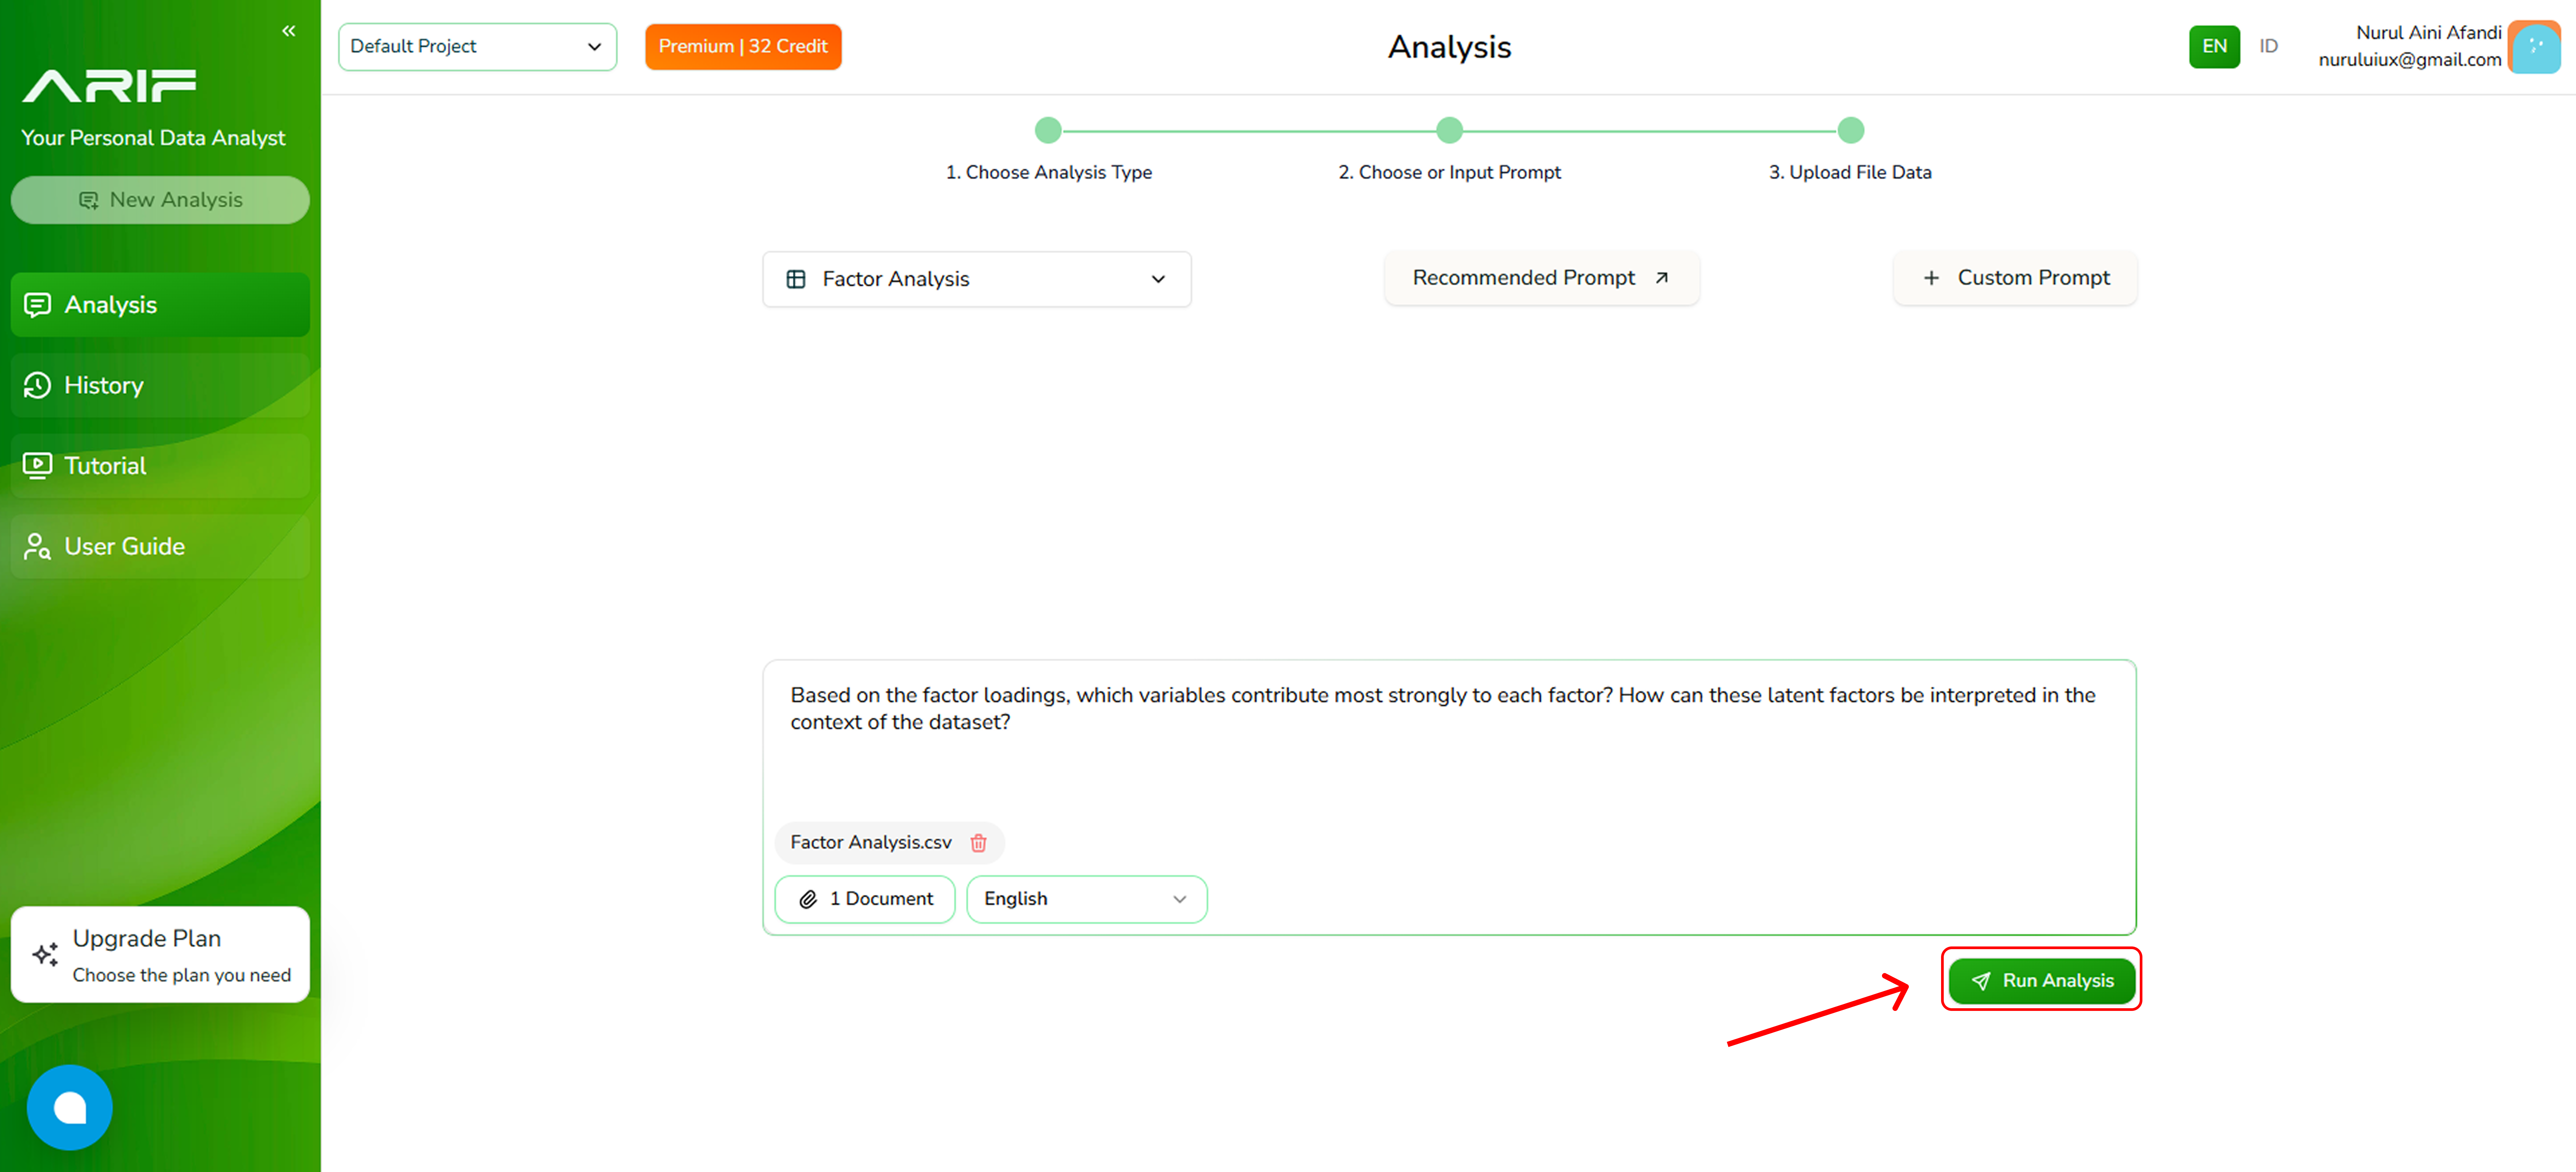
5. Make sure you’ve selected the correct prompt and file, then click **“Run Analysis”** and wait for the system to process your data. The processing time depends on the file size.
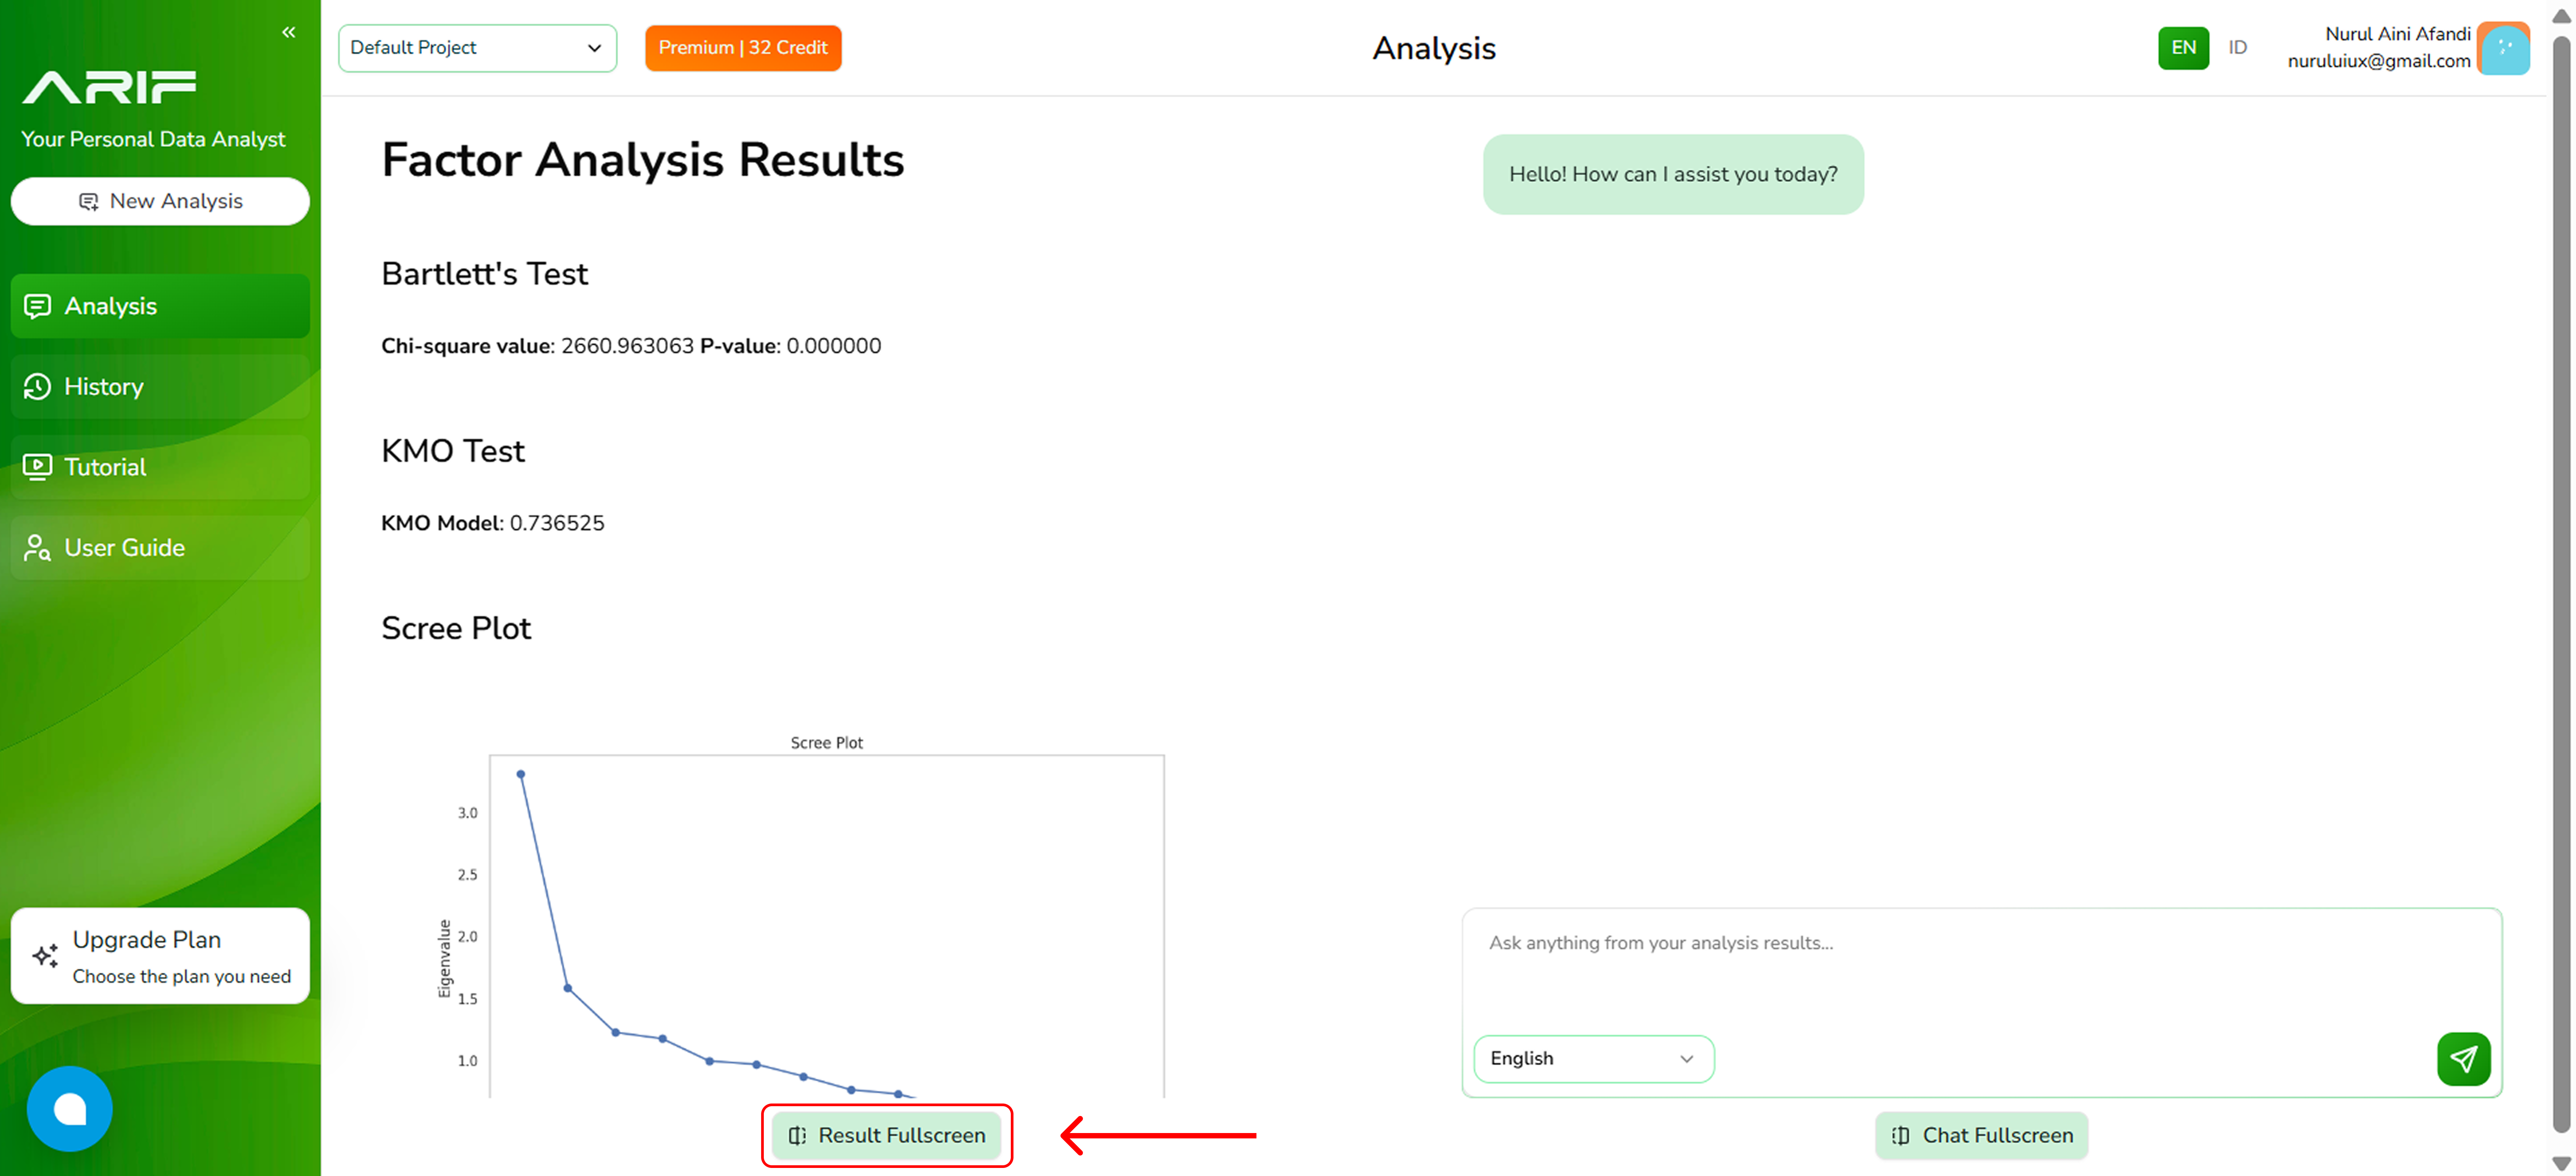
6. The analysis results will appear on the left panel, while the right panel allows you to ask follow-up questions about the analysis.
7. If you wish to view a full screen of your result analysis, click on **"Result Fullscreen"** at the bottom of the panel to expand the view.
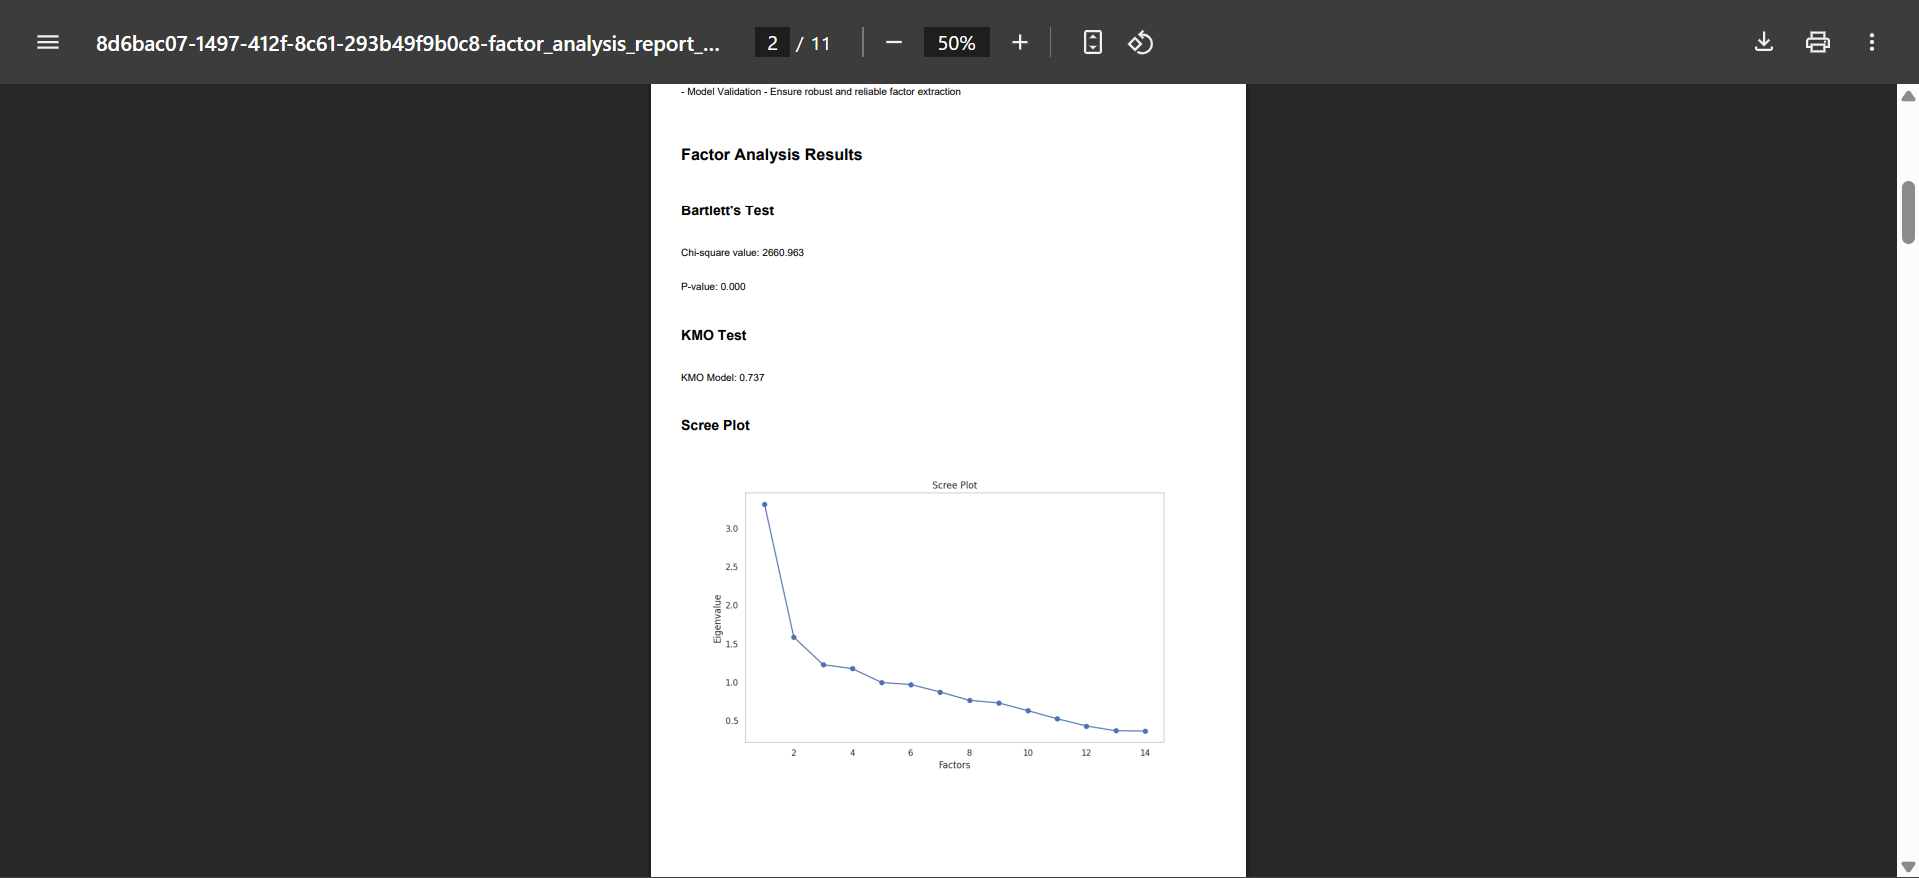
8. Then Press **“Download Analysis Result”** to choose the file type you want to download. You can select **Insight Summary** for a curated, high-level overview, or **Statistical Analysis** for insights with statistical calculation.
9. Your analysis results are now available in PDF format.
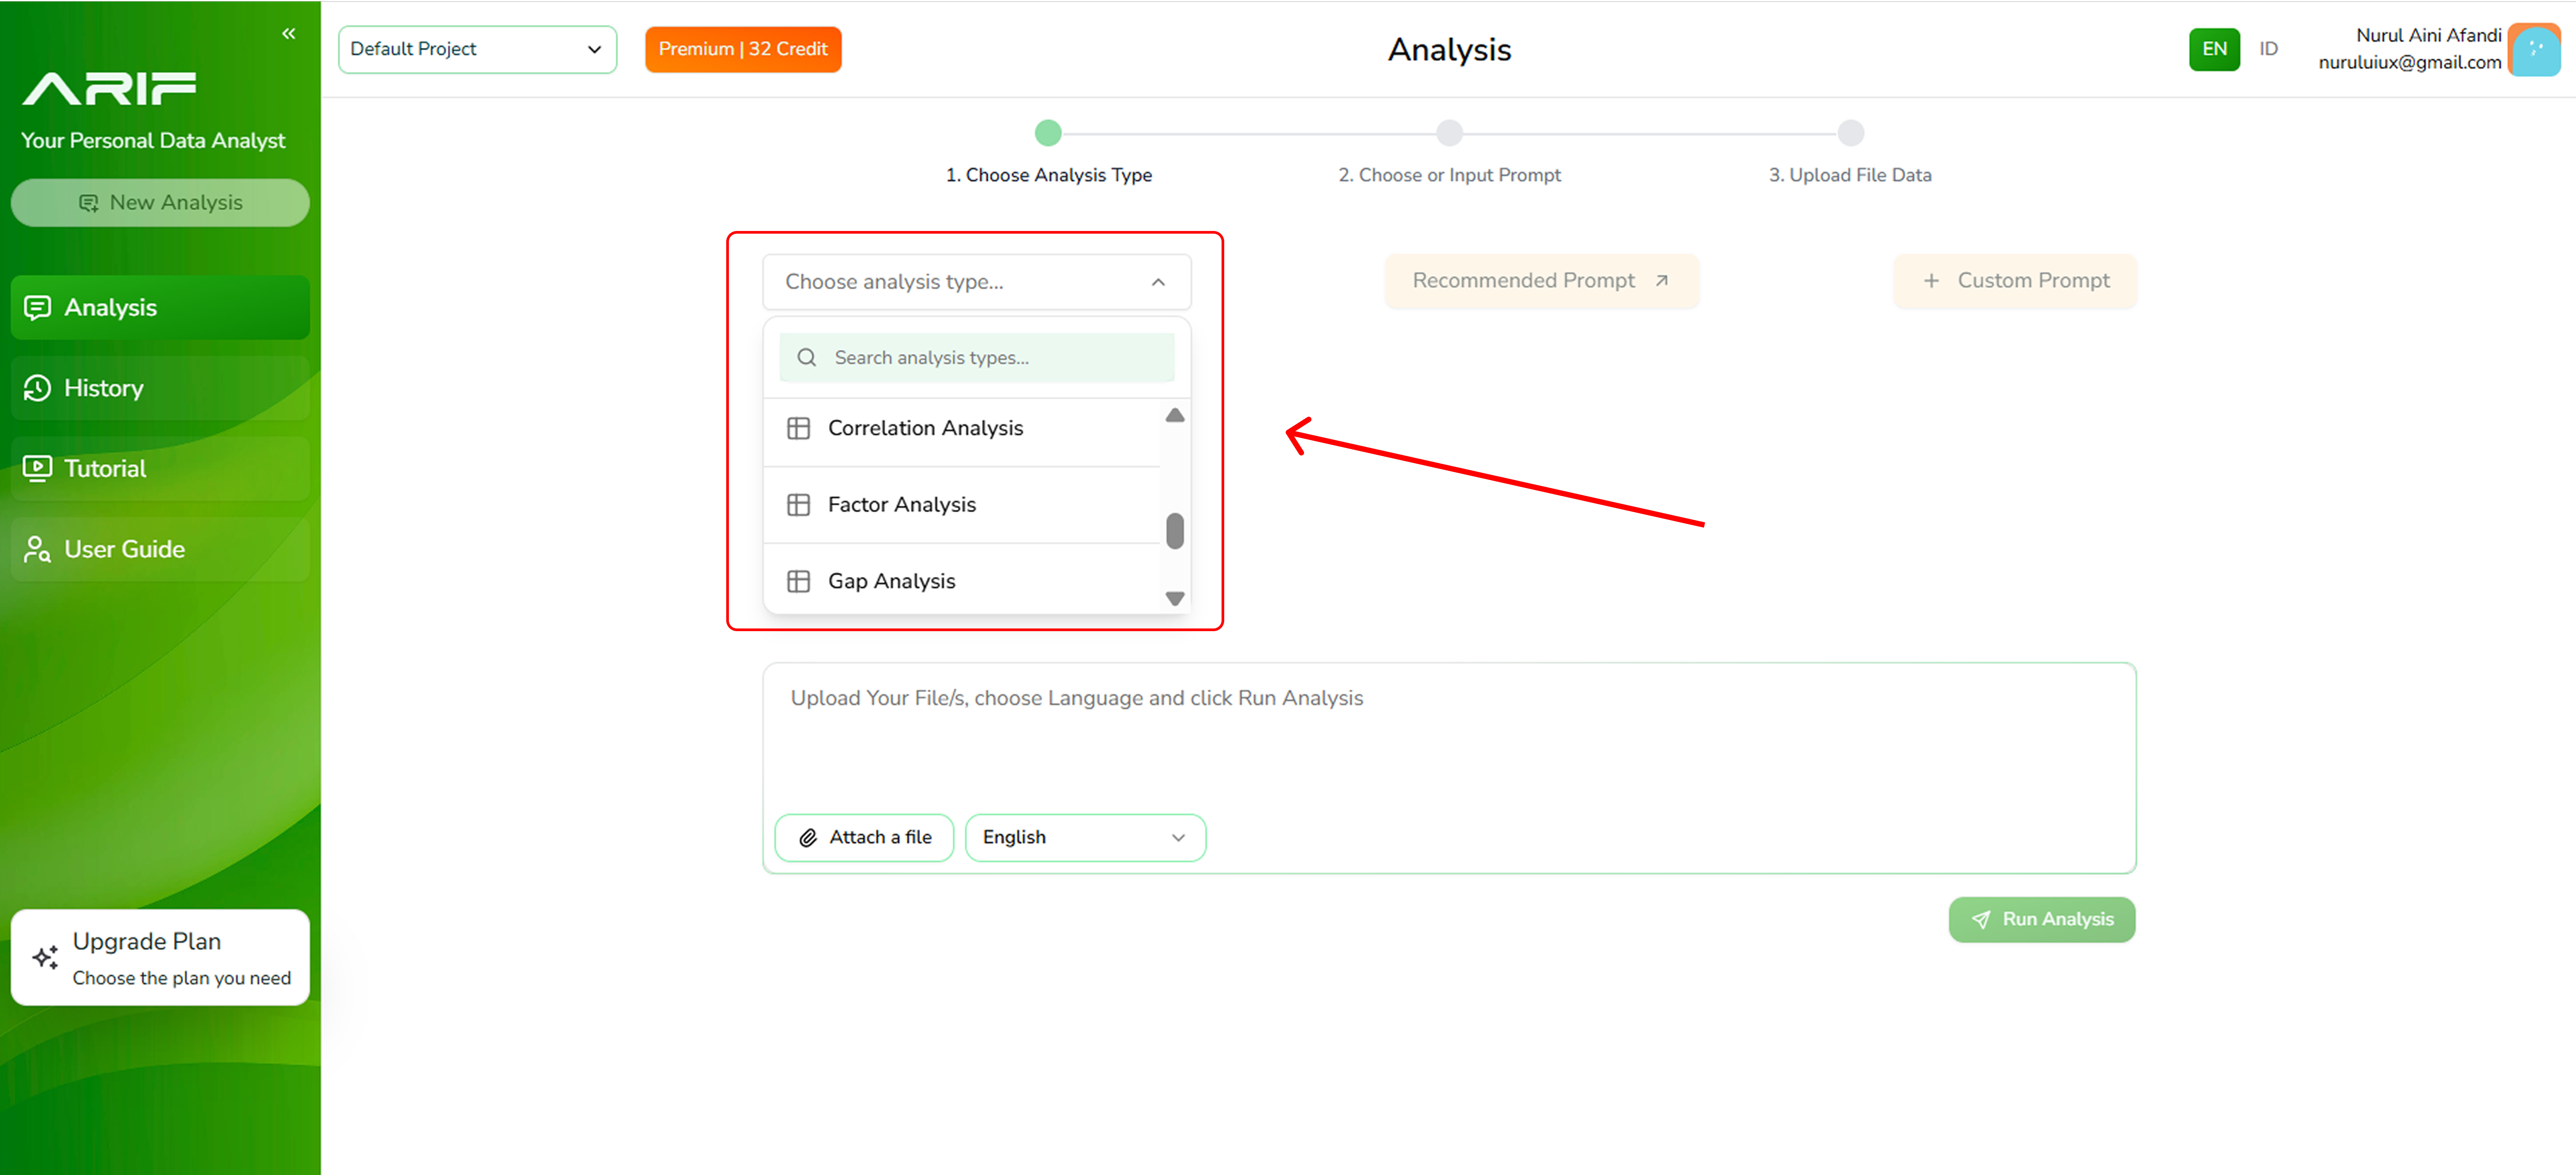 2. You need a prompt which basically is a question or an instruction to drive the analysis result. Choose one of the **Recommended Prompts** from the list for a quick, expert-driven setup.
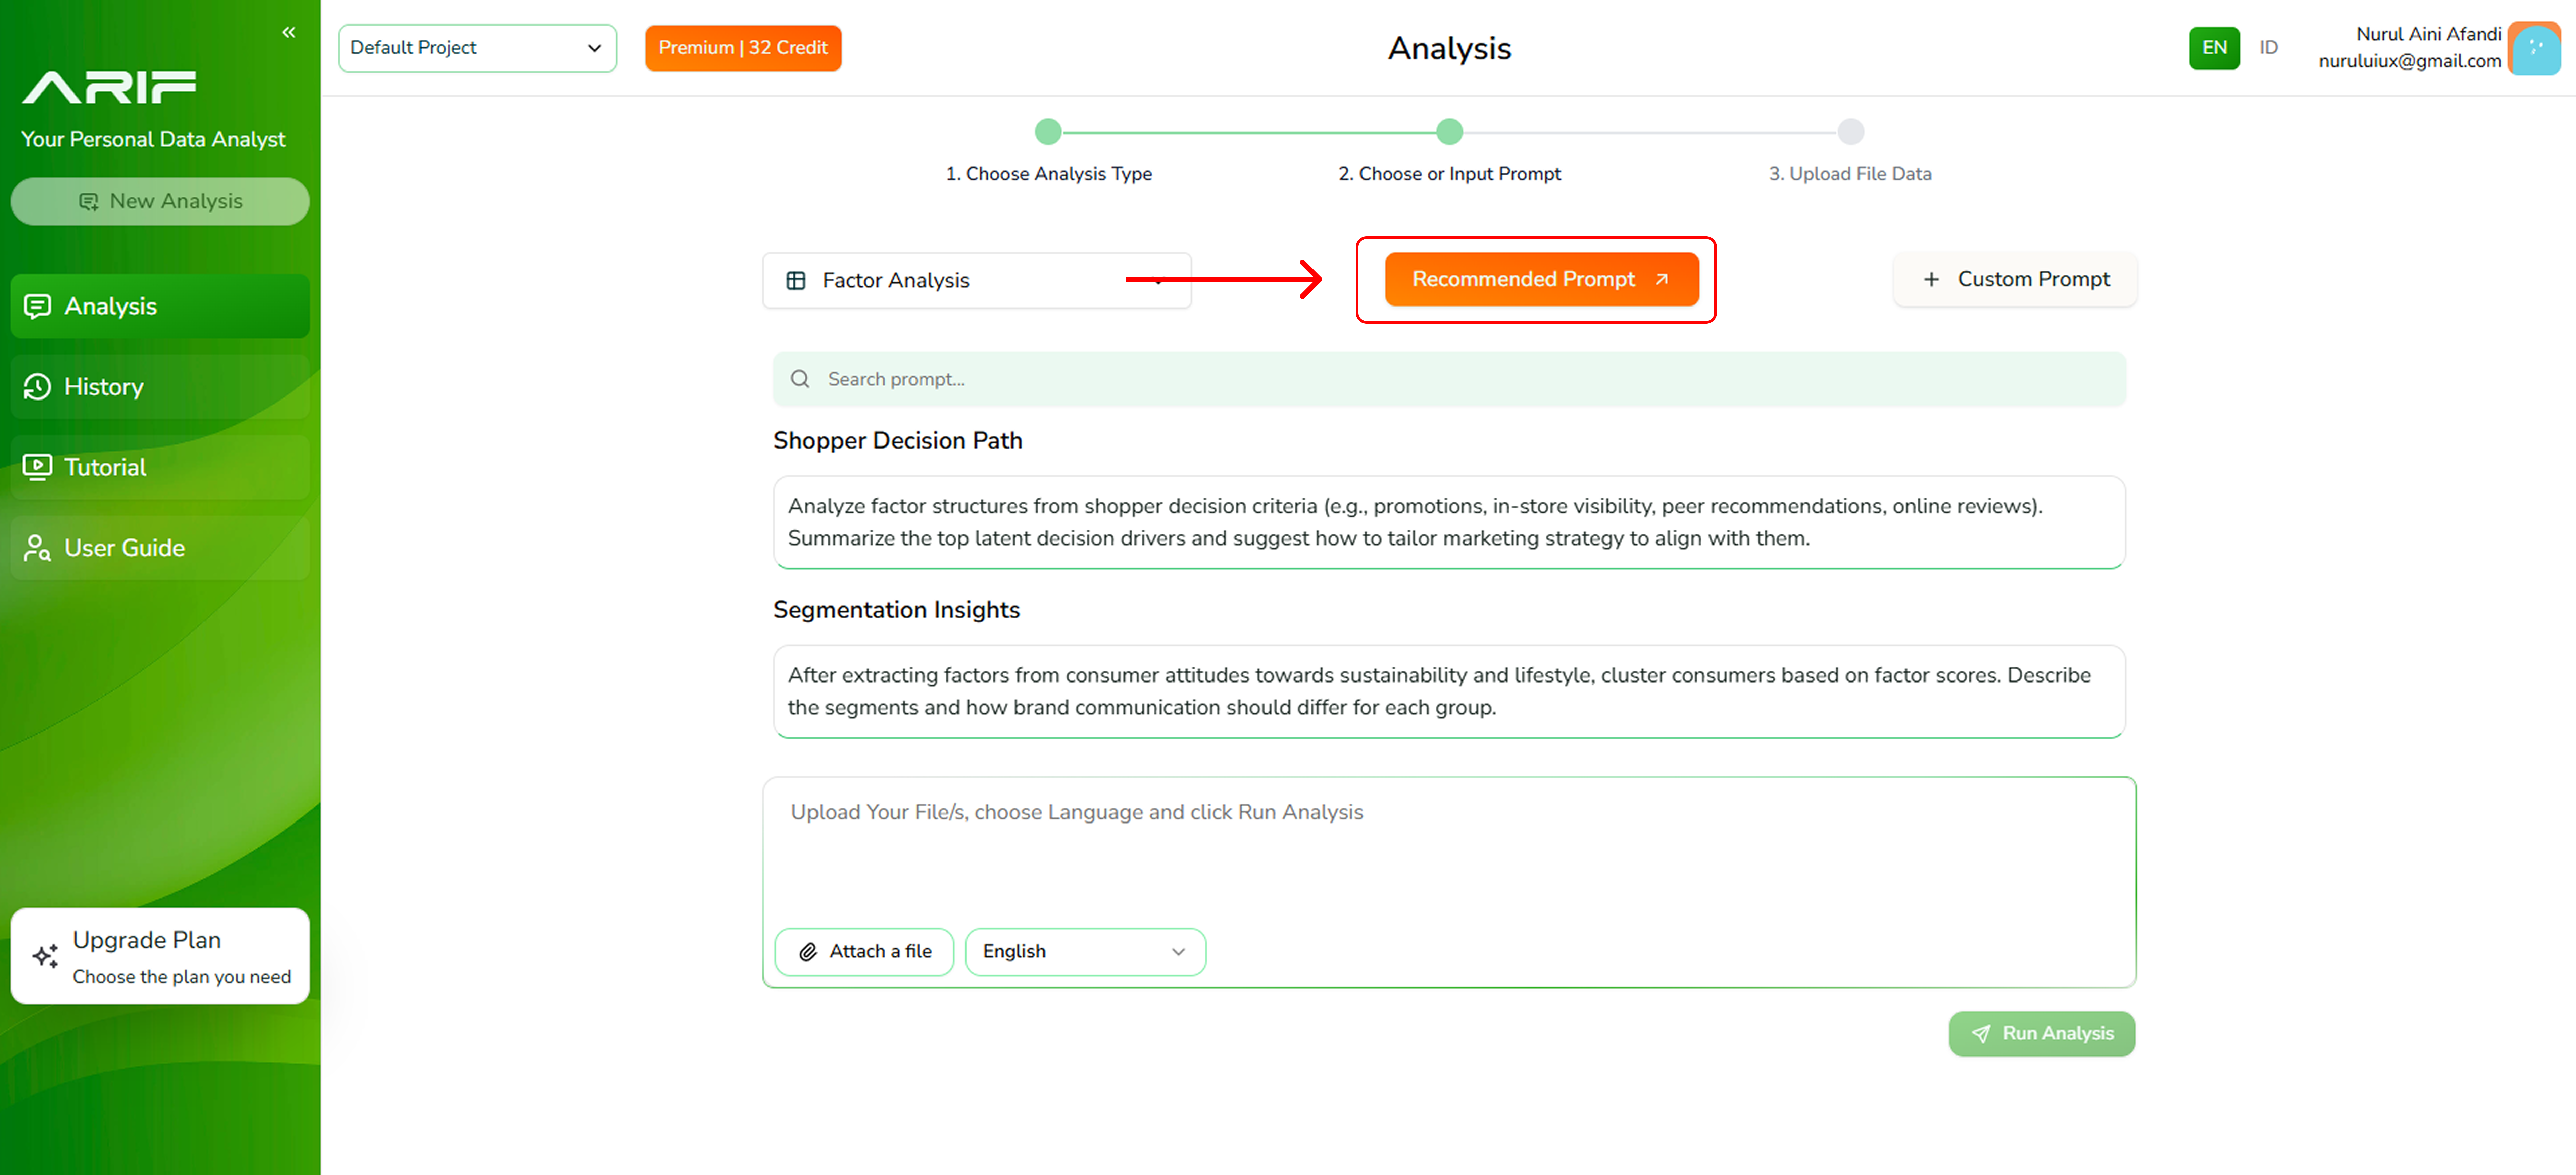 3. Or write your own prompt depending on the insights you want to gain from your data by clicking the **“Custom Prompt”** button.
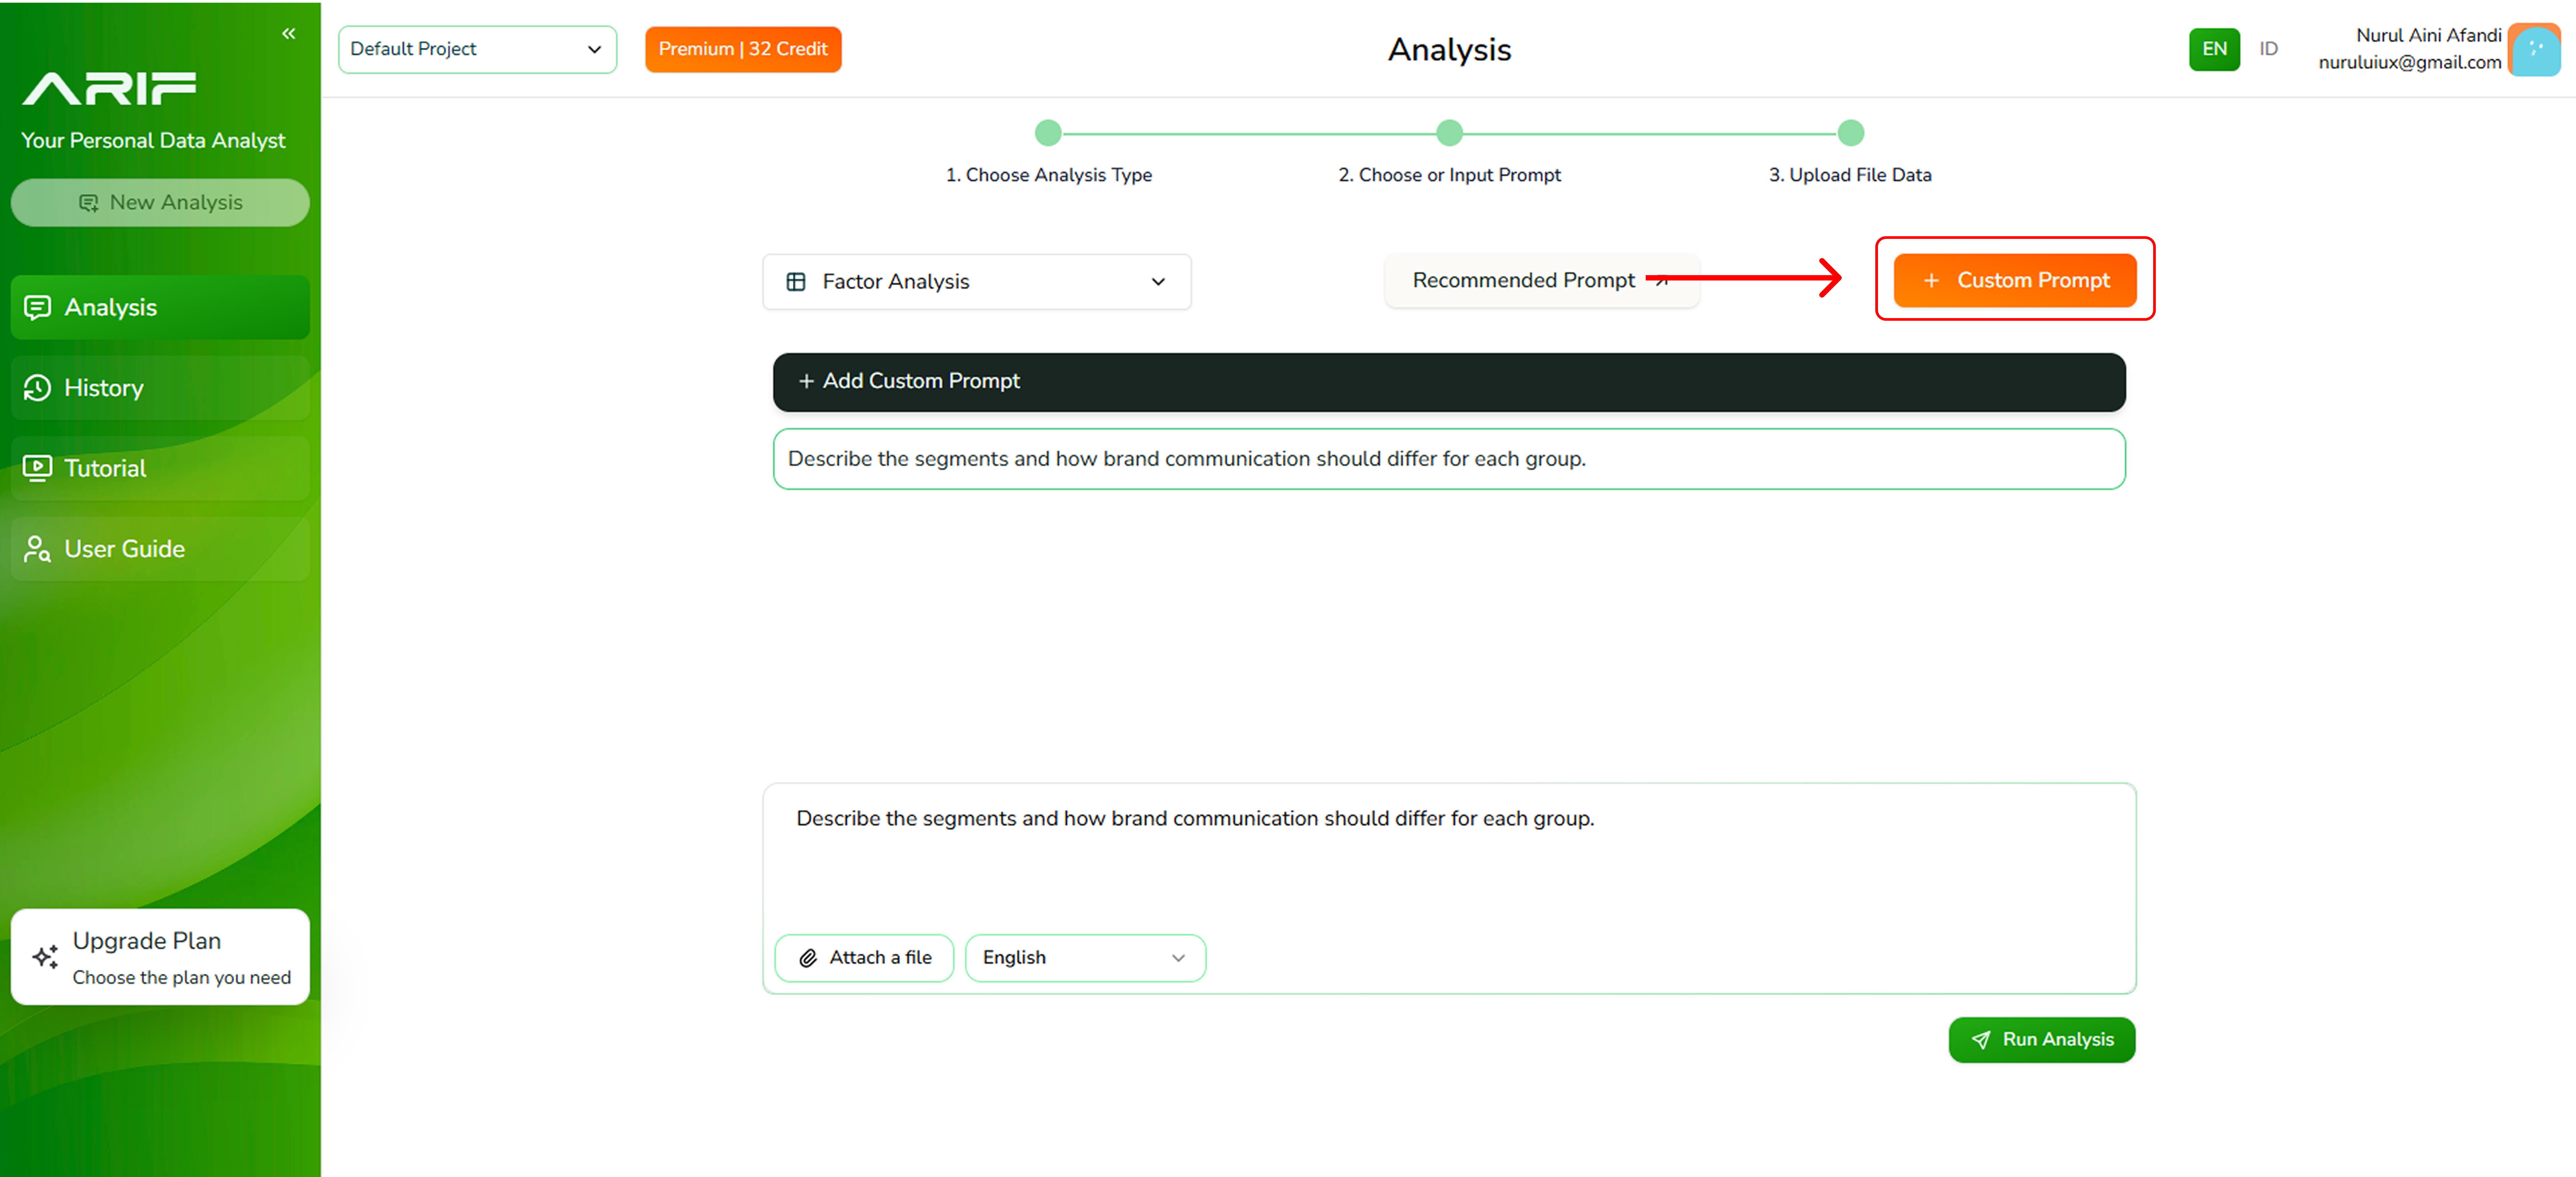 4. If you choose to create your own prompt, click **“+ Add Custom Prompt”**. A pop-up window will appear where you can write your prompt.
 5. Click the **“Attach a File”** button to upload your file in one of the supported formats: .csv or .xls with a maximum file size of 2 MB each.
 5. Make sure you’ve selected the correct prompt and file, then click **“Run Analysis”** and wait for the system to process your data. The processing time depends on the file size.
 6. The analysis results will appear on the left panel, while the right panel allows you to ask follow-up questions about the analysis.
7. If you wish to view a full screen of your result analysis, click on **"Result Fullscreen"** at the bottom of the panel to expand the view.
6. The analysis results will appear on the left panel, while the right panel allows you to ask follow-up questions about the analysis.
7. If you wish to view a full screen of your result analysis, click on **"Result Fullscreen"** at the bottom of the panel to expand the view.
 8. Then Press **“Download Analysis Result”** to choose the file type you want to download. You can select **Insight Summary** for a curated, high-level overview, or **Statistical Analysis** for insights with statistical calculation.
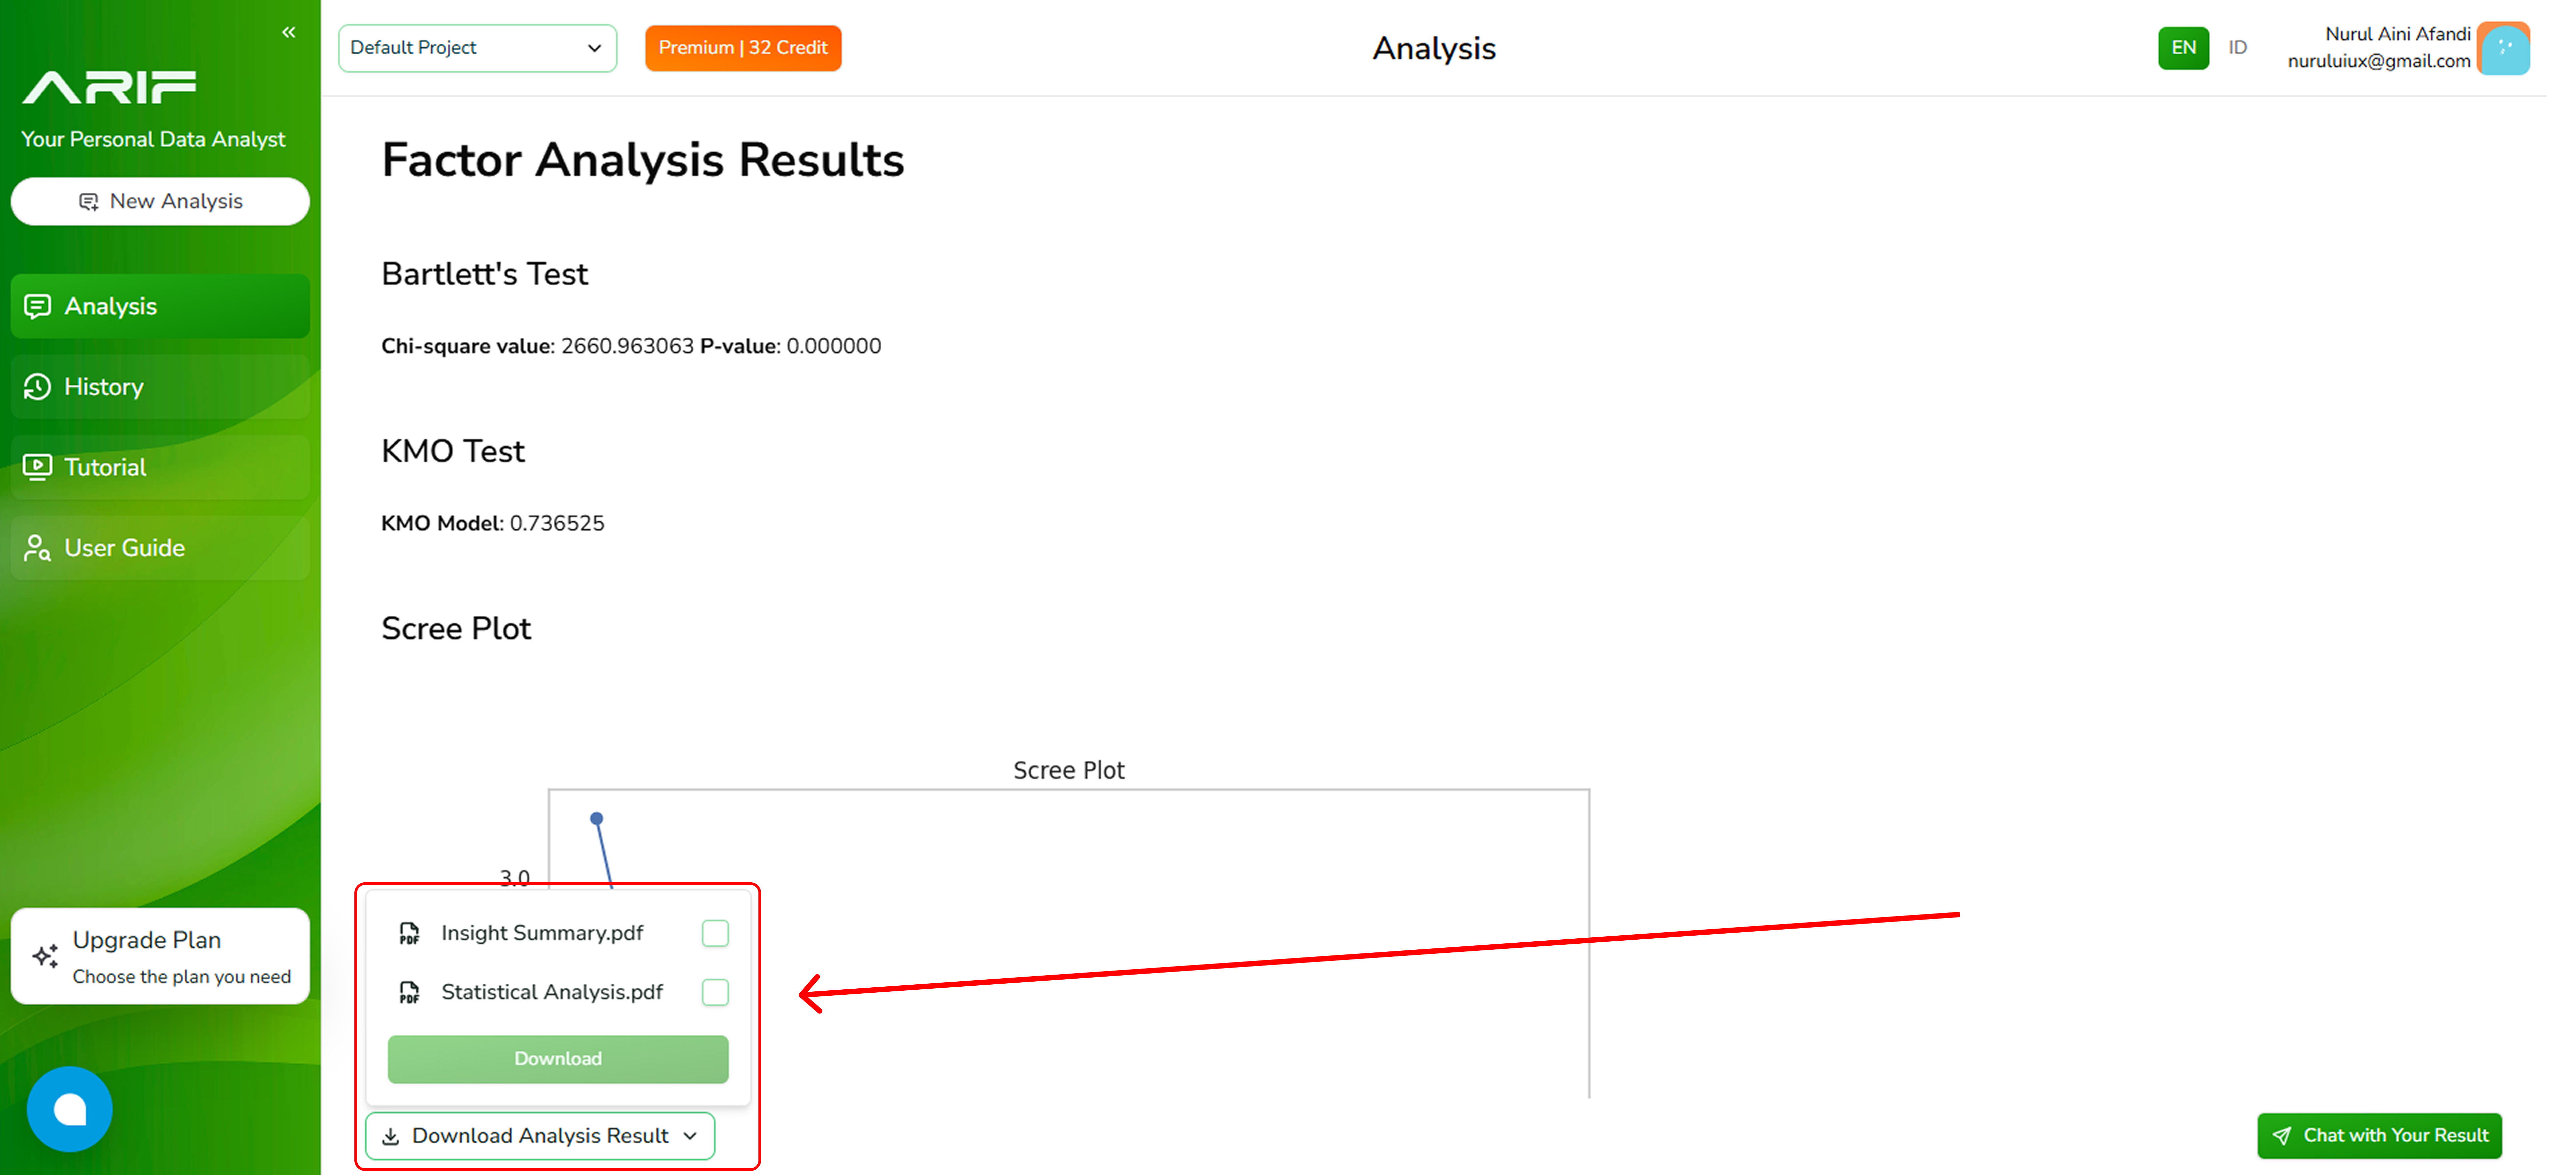 9. Your analysis results are now available in PDF format.